Three-dimensional urban power supply service command center data visualization method

A command center, three-dimensional technology, applied in the field of data visualization of the three-dimensional city power supply service command center, can solve the problem of difficult to intuitively and effectively reflect the current status of power supply services in the distribution network, and achieve the effect of improving scientificity.

Pending Publication Date: 2019-09-13
SHENYANG UNIV
View PDF5 Cites 7 Cited by
  • Summary
  • Abstract
  • Description
  • Claims
  • Application Information

AI Technical Summary

Problems solved by technology

At present, it is difficult to intuitively and effectively reflect...

Method used


Image

  • Three-dimensional urban power supply service command center data visualization method

Examples


Embodiment Construction

[0023] The present invention will be described in detail below in conjunction with the embodiments shown in the accompanying drawings.

[0024] In order to clearly illustrate the technical solution of the application, the functional drawings mentioned in the application are now briefly introduced. The following drawings only show some cases of the application, and are not intended to limit the scope. All other embodiments obtained by those skilled in the art based on the structure of the present application without creative efforts belong to the scope of protection of the present application.

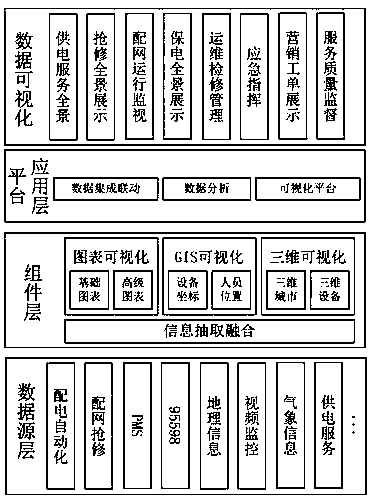
[0025] figure 1 It shows a schematic structural diagram of the data visualization technology of the three-dimensional urban power supply service command center provided by the application, including the data source layer, component layer, platform application layer and data visualization function.

[0026] The present invention is a three-dimensional city-based power supply service com...


PUM


Abstract

The invention discloses a three-dimensional urban power supply service command center data visualization method, and relates to a data visualization method. The three-dimensional urban power supply service command center data visualization method, carries out big data analysis on the business data in a database, integrates multi-source business system information such as power distribution automation, power distribution network first-aid repair, dispatching automation, a production management system, a marketing management system, video monitoring and the like, realizes three-dimensional virtual modeling of a power protection area, and integrally displays information such as a power protection scheme, an important user power supply path, an important user wiring mode, a power protection area main grid frame, a power protection area distribution grid frame and intra-station and extra-station monitoring videos. The three-dimensional urban power supply service command center data visualization method has the functions of data collection of a three-dimensional city, generation of a building model, monitoring of the operation state of power distribution network equipment based on the three-dimensional city, display of the emergency repair and power maintenance state of the power distribution network, emergency command and the like. The three-dimensional urban power supply service command center data visualization method comprehensively considers data integration linkage, completes screen direct monitoring, and displays statistical analysis conditions in real time.

Description

technical field [0001] The invention relates to a central data visualization method, in particular to a three-dimensional urban power supply service command center data visualization method. Background technique [0002] The distribution network is a system with a wide area, a large amount of data and rapid changes. Monitoring the real-time data of the distribution network is the key to the safe operation of the power system. With the continuous improvement of the distribution network construction, the distribution network has put forward higher requirements for the quality of power supply services. Based on the data visualization technology of the power supply service command center in a three-dimensional city, fully combining advanced computer technologies such as big data analysis, GIS, and three-dimensional virtualization, it integrates distribution automation, distribution network emergency repair, scheduling automation, production management system, marketing managemen...

Claims


Application Information

Patent Timeline
IPC IPC(8): G06F16/26G06F16/29G06Q50/06
CPCG06F16/26G06F16/29G06Q50/06
Inventor 常颖孙世能吴宝举高强苑春莉韩晓微
Owner SHENYANG UNIV
Why Eureka
Try Eureka