Measured value visualization

a technology of measurement value and visualization, applied in the field of industrial data visualization systems, can solve problems such as reducing the utility of visualization

Active Publication Date: 2010-12-09
ROCKWELL AUTOMATION TECH
View PDF13 Cites 10 Cited by
  • Summary
  • Abstract
  • Description
  • Claims
  • Application Information

AI Technical Summary

Problems solved by technology

A drawback of this type of visualization is that target values and tolerance ranges generally remain fixed in the linear repres

Method used


Image

  • Measured value visualization
  • Measured value visualization
  • Measured value visualization

Examples


Embodiment Construction

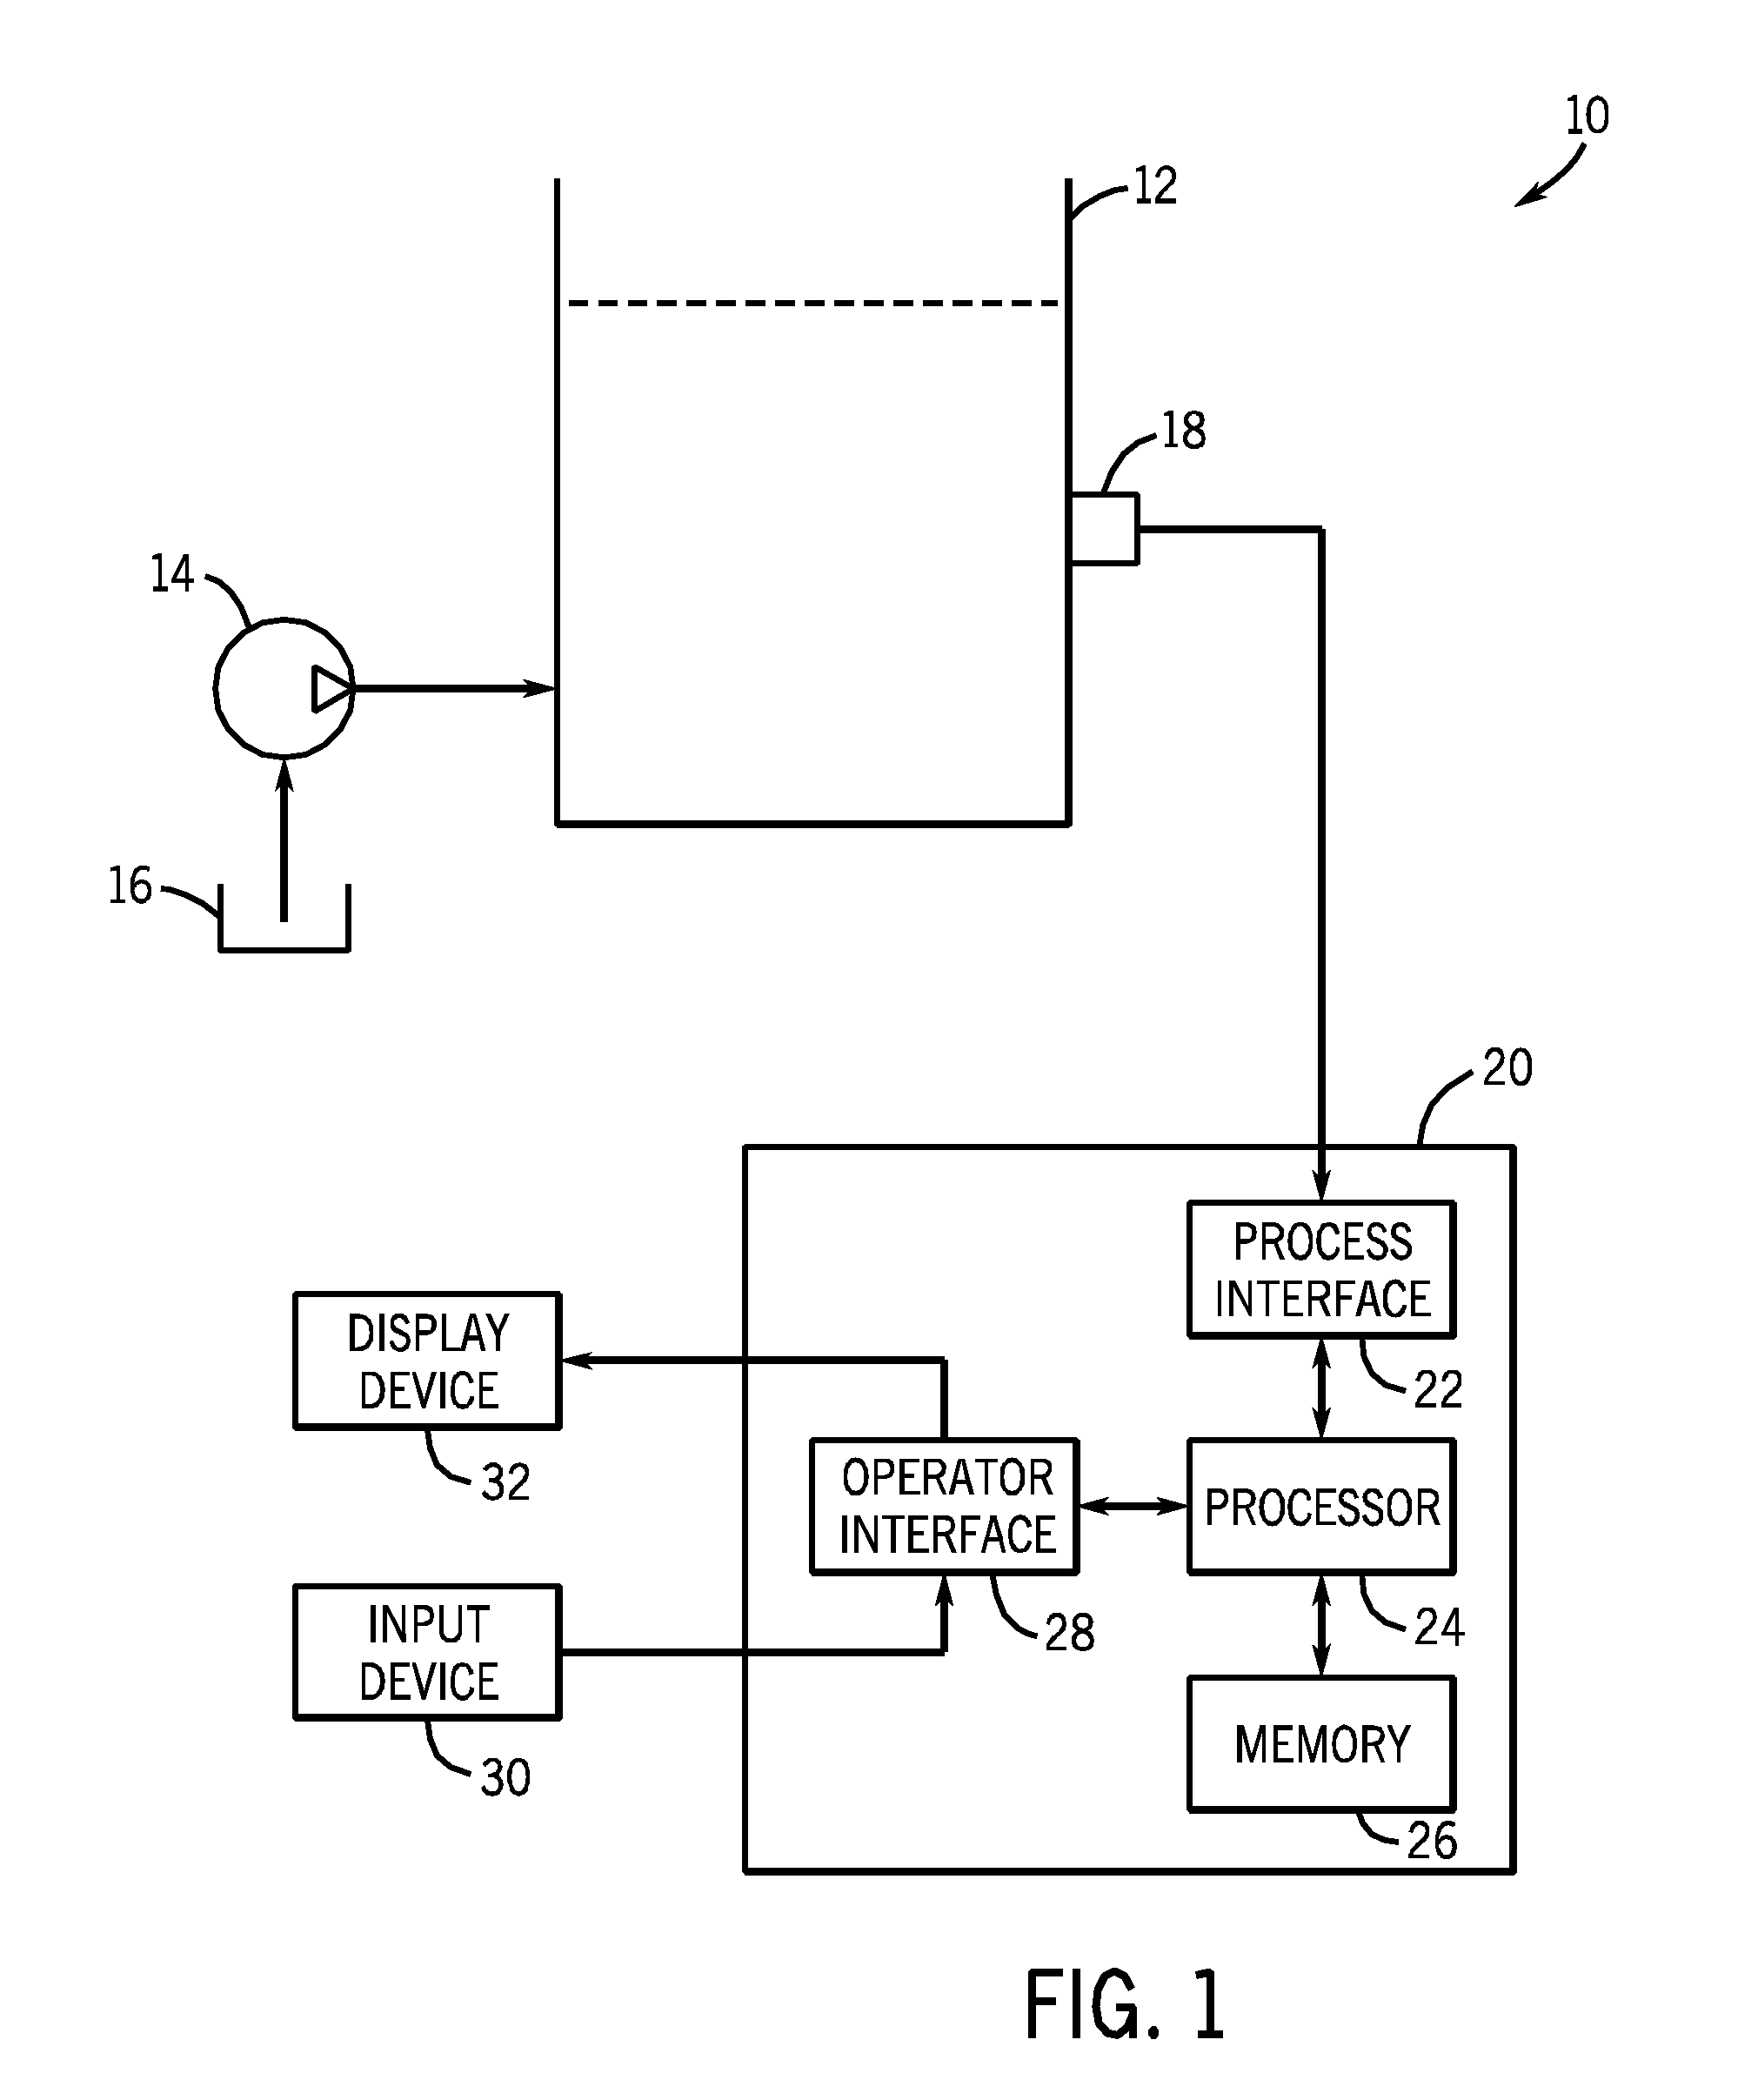
[0015]FIG. 1 is a block diagram of an exemplary embodiment of an industrial measurement process 10, which may utilize the disclosed methods and techniques for visualizing measured parameter values with respect to target or tolerance limit parameter values. As illustrated, the industrial measurement process 10 may include a container 12, into which one or more measured substances may be dispensed. The container 12 may be a flask, tank, tray, receptacle, or any other container capable of containing the one or more measured substances. One or more dispensing devices 14 may be used to draw the one or more measured substances from one or more sources 16. For example, the one or more dispensing devices 14 may include valves and pumps, which may draw substances from the sources 16 and input them into the container 12.

[0016]However, in general, the embodiments disclosed herein may be particularly beneficial for industrial measurement processes 10 which include manual dispensing of substance...


PUM


Abstract

The embodiments of the present invention provide novel techniques for visualizing parameter values, such as parameter values measured in an industrial measurement process. In particular, the disclosed embodiments provide visualization techniques for re-scaling a representation of a target parameter range with respect to an overall parameter range for a parameter value. Re-scaling the representation of the target parameter range effectively provides continuous dynamic zooming for the measured parameter value. This allows for better visualization as well as providing continuous feedback to an operator of the industrial measurement process regarding the current measured parameter value, thereby facilitating faster and more accurate operation of the industrial measurement process.

Description

CROSS REFERENCE TO RELATED APPLICATIONS[0001]This application is a Non-Provisional Application of U.S. Provisional Application No. 61 / 184,508, entitled “Measured Value Visualization,” filed Jun. 5, 2009, which is herein incorporated by reference.BACKGROUND[0002]The invention relates generally to the field of industrial data visualization systems. More particularly, embodiments of the present invention relate to techniques for visualizing measured parameter values with respect to target or tolerance limit parameter values on a display device.[0003]In industrial data visualization systems, a common form of visualization of a parameter value is a linear representation depicted as extending from a fixed starting point (e.g., zero) to a fixed ending point (e.g., an upper value limit). As the parameter value increases, a bar representing the parameter value typically moves along the linear representation from the starting point to the ending point. A drawback of this type of visualization...

Claims


Application Information

Patent Timeline
IPC IPC(8): G06F3/048
CPCG01D7/00G09G2340/04
Inventor PREYSMAN, VLADIMIRBRAUN, STEFANDITTMER, MARTIN
Owner ROCKWELL AUTOMATION TECH
Why Eureka
Try Eureka