Visual display characterization
a technology of visual calorimetry and characterization, applied in the field of visual calorimetry of displays, to achieve the effect of complete visual calorimetric characterization and more repeatable and accurate characterization of displays
- Summary
- Abstract
- Description
- Claims
- Application Information
AI Technical Summary
Benefits of technology
Problems solved by technology
Method used
Image

Examples
case1
[0091]T2Case1=f([RGB]Case1)=[rgb]Case1(60)T2Case2=f([RGB]Case2)=[rgb]Case2(61)T2Case3=f([RGB]Case3)=[rgb]Case3(62)
[0092]The test stimuli (T2) for the three cases ate decomposed into base (Tbase) and added components (Ts) by subtracting off the calorimetric channel scalars of the base from the test stimuli, giving:
[0093]TSCase1=[rgb]Case1-[rgb]base=[r1g1b1](63)TSCase2=[rgb]Case2-[rgb]base=[r2g2b2](64)TSCase3=[rgb]Case3-[rgb]base=[r3g3b3](65)
[0094]The scalars given in Eqs. 63-65 are used to create the set of linear equations as shown in Eq. 57, making it possible to solve for the relative channel-luminance ratios:
[0095]Y^redY^greenandY^blueY^green.(66)
These relative channel-luminance ratios are then combined with a C matrix, determined from a neutral identification process, as given in Eq. 10, to form a relative colorimetric mixing matrix (M) for the display.
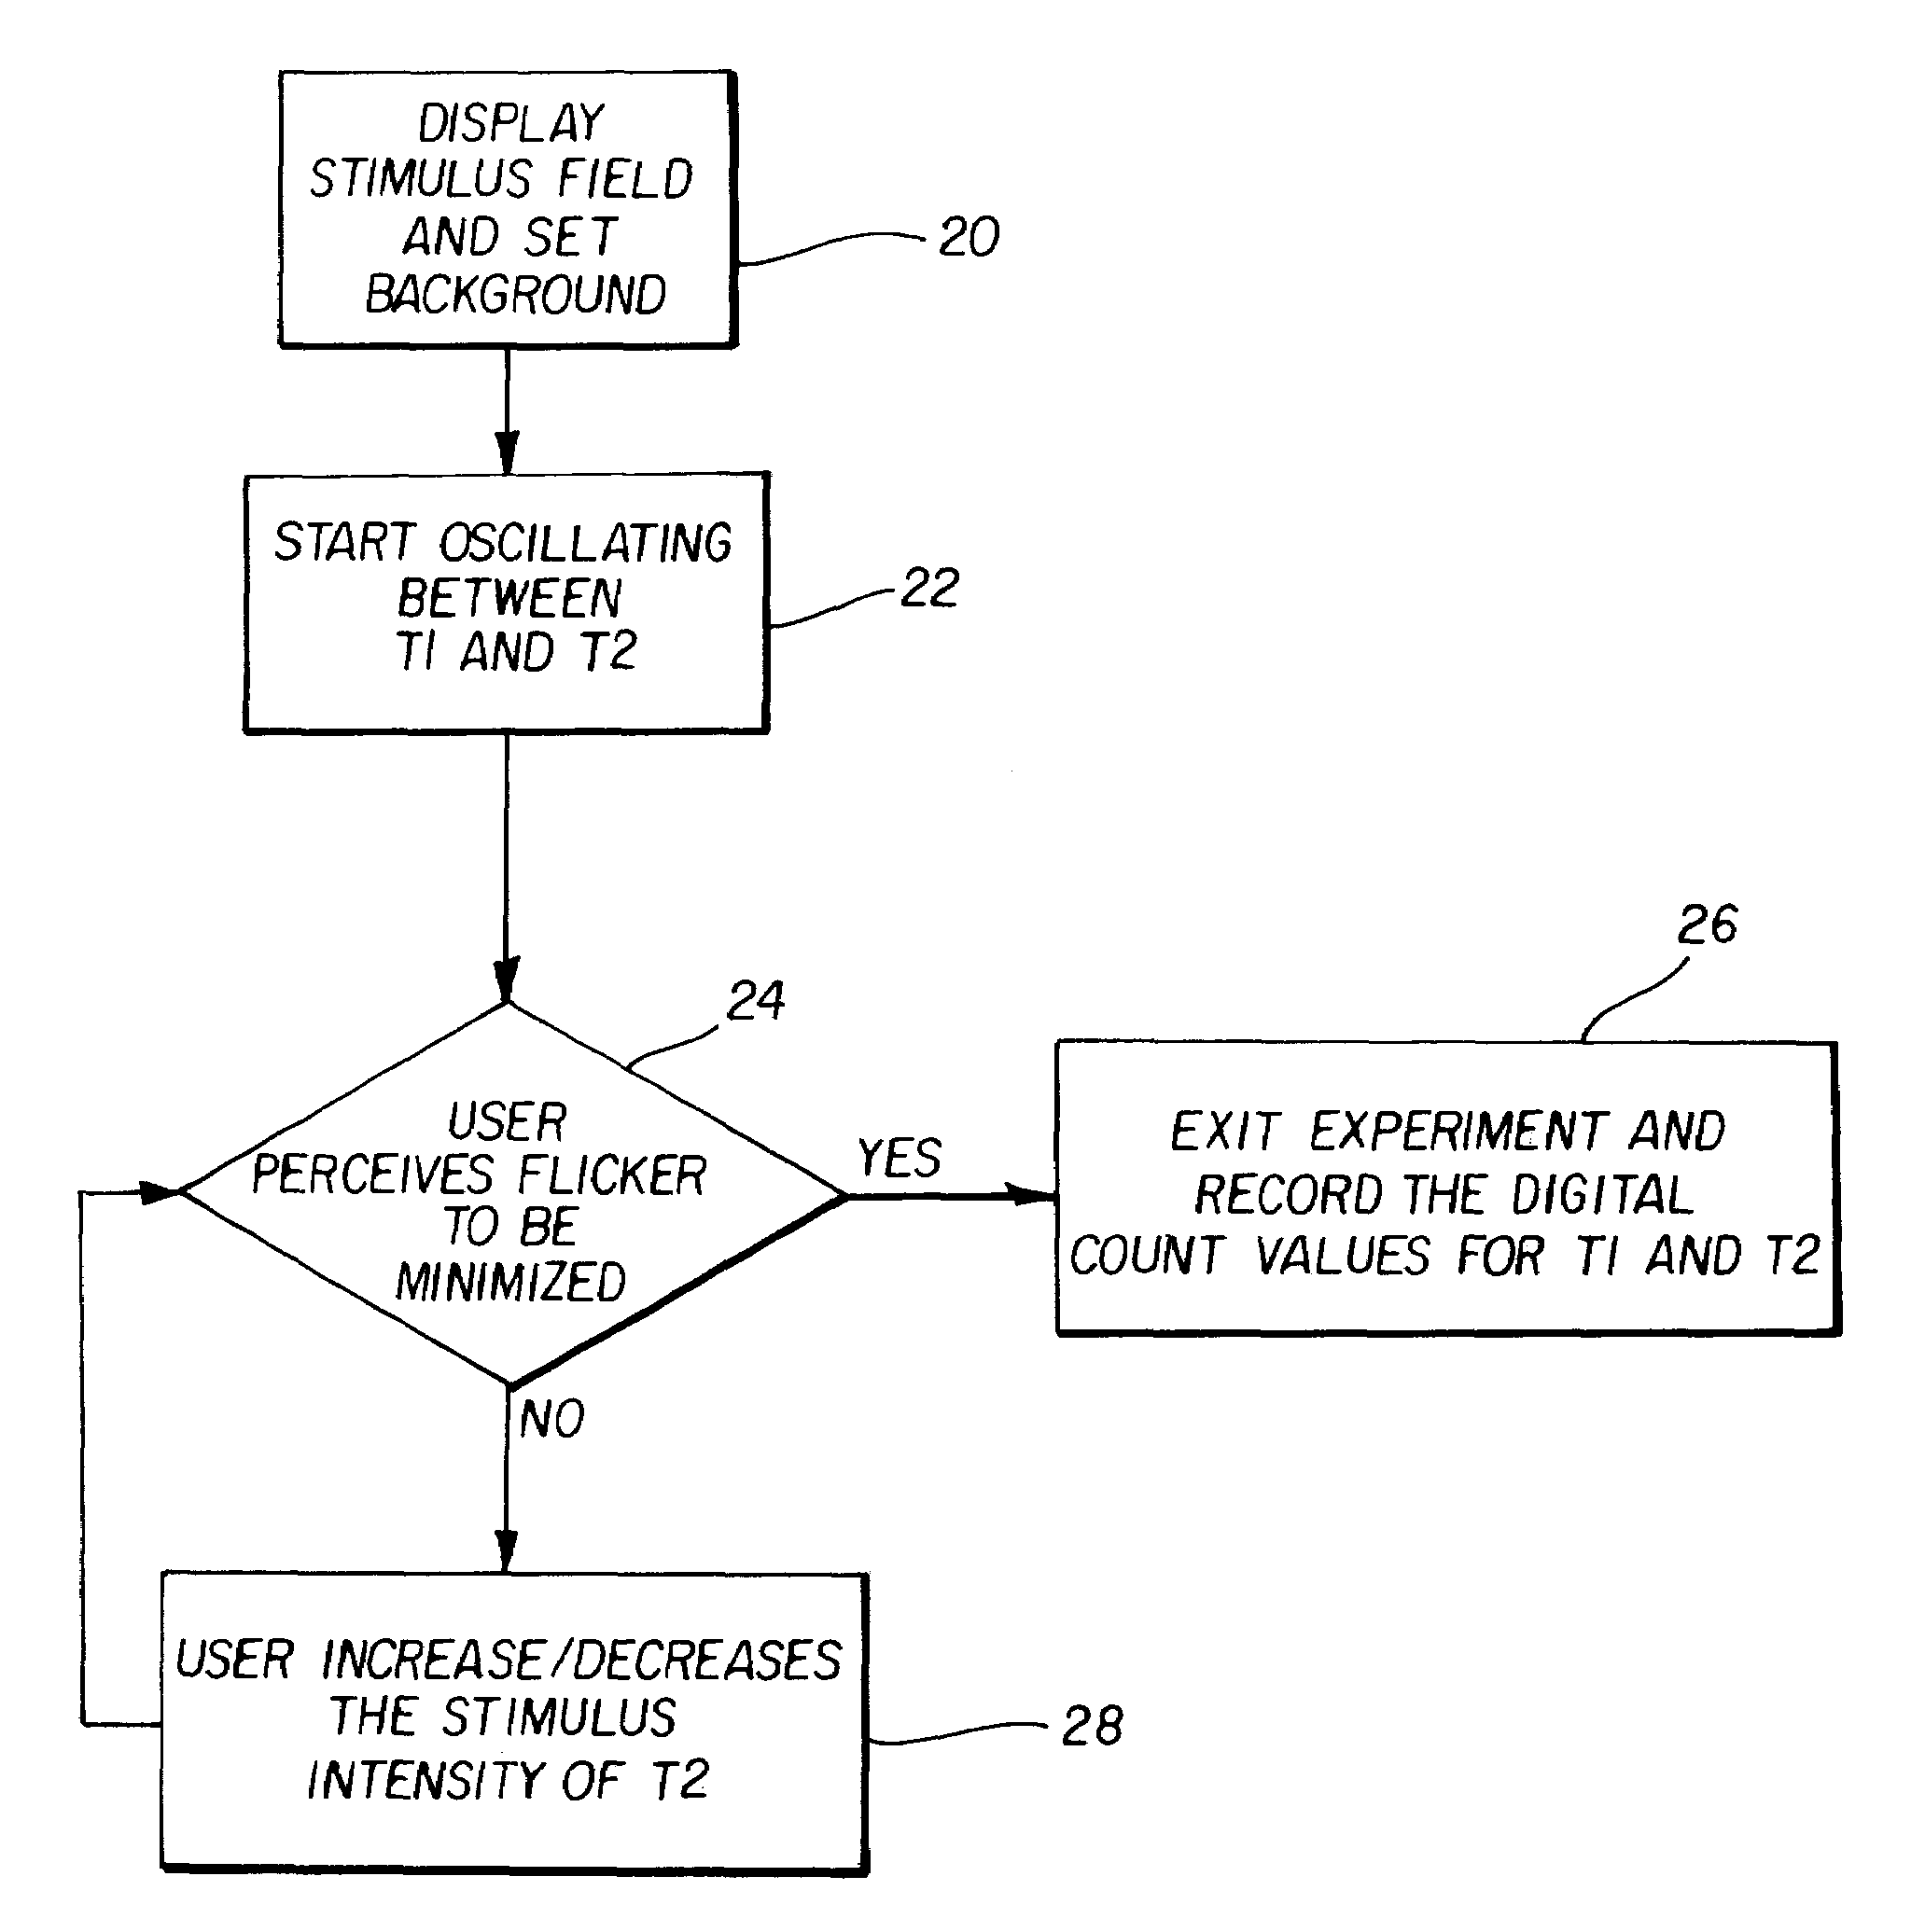
[0096]In a further approach, the channel ratios are determined by flickering against a pure channel (e.g., green) and the...
PUM
 Abstract
Description
Claims
Application Information