Method and apparatus for visually displaying high-frequency financial time sequence correlation

A financial time series and correlation technology, applied in finance, instrumentation, data processing applications, etc., can solve the problems that cannot reflect the change of correlation state time, the measurement method that does not reflect the probability of different correlation patterns, the lack of accuracy, etc. question

Pending Publication Date: 2016-06-01
NINGBO DAHONGYING UNIV
View PDF0 Cites 4 Cited by
  • Summary
  • Abstract
  • Description
  • Claims
  • Application Information

AI Technical Summary

Problems solved by technology

[0004] However, the above three methods all have shortcomings: (1) The method of direct original data drawing needs to rely on manual judgment of the degree of correlation, lacks accuracy, and has no objective judgment standard
(2) The method of the correlation coefficient curve can only reflect the change of the correlation of a pair of data series with time, and cannot reflect the status of the correlation between multiple data
(3) Methods such as correlation matrix heat map can reflect the correlation state between multiple data series, but they cannot reflect the change of correlation state over time, and there is no measurement method to reflect different correlation patterns and their probabilities
[0016] However, the correlation coefficient can only reflect the correlation relationship between two data series as a whole, and the data series of many nonlinear processes often show different local correlation characteristics.

Method used


Image

  • Method and apparatus for visually displaying high-frequency financial time sequence correlation
  • Method and apparatus for visually displaying high-frequency financial time sequence correlation
  • Method and apparatus for visually displaying high-frequency financial time sequence correlation

Examples


Embodiment 1

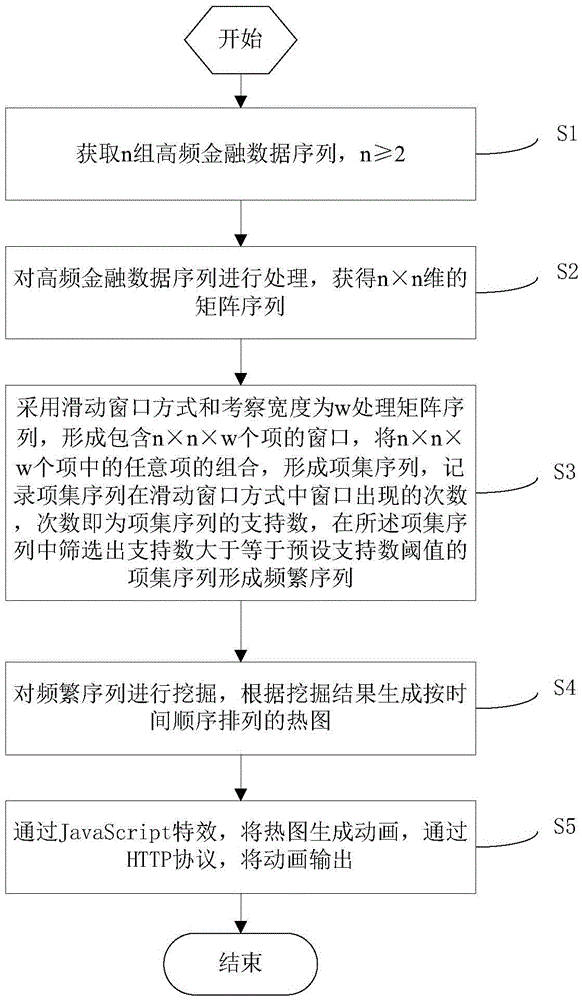
[0054] Taking the high-frequency stock price data as an example, considering the observed data in a certain time window, the logarithmic rate of return is:

[0055] R t =ln(P t )-ln(P t-1 )

[0056] where P t is the closing price on day t, and the rate of return R t is a time series.

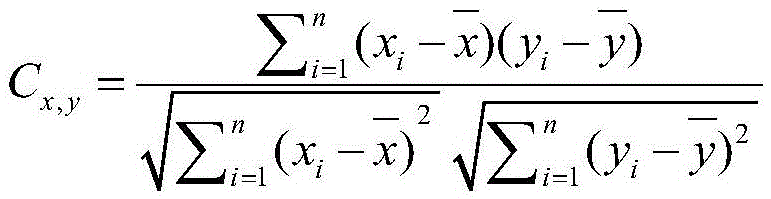
[0057] Collect two yield time series x and y;

[0058] The Pearson correlation coefficient of x and y is:

[0059] C x , y = Σ i = 1 n ( x i - x ‾ ) ( y i - ...

Embodiment 2

[0068] Collect two discrete logarithmic return sequences x and y over a time period;

[0069] The states of x and y at time n are denoted as i n and j n ; Due to the short memory of the logarithmic return sequence, for simplicity, assuming that the sequence is a first-order Markov process, the transfer entropy from x to y is:

[0070] TE x → y = Σ i n + 1 , i n , j n p ( i n + 1 , i n , j n ...


PUM


Abstract

The invention discloses a method for visually displaying high-frequency financial time sequence correlation. The method comprises the following steps: obtaining n groups of high-frequency financial data sequences, wherein n is greater than and equal to two; and processing the high-frequency financial data sequences to obtain n*n-dimensional matrix sequence; and processing the matrix sequence by use of a slide window mode and an investigation width of w to form a window including n*n*w items, combining any items among the n*n*w items to form item set sequences, recording the frequency of the item set sequences occurring in the window in the slide window mode, and screening a frequent sequence formed by an item set sequence whose support number is greater than and equal to a preset support number threshold from the item set sequences, wherein the frequency is the support number of the item set sequences. The invention provides a device for visually displaying high-frequency financial time sequence correlation. According to the technical demand for financial time sequence analysis, correlation between multiple financial time sequence data can be visually and rapidly determined and the existence mode of a correlation status is discovered.

Description

technical field [0001] The invention relates to the field of financial statistics, in particular to a method and device for visually displaying the correlation of high-frequency financial time series. Background technique [0002] At present, the common method in the market is to use display curves to assist manual judgment of the correlation between assets such as stocks; generally three methods are used: (1) Direct drawing method: This method is used by most stock trading systems; Directly draw graphs using raw data or their simple transformation results; generally, scatter plots or graphs are commonly used; the degree of correlation is determined by manual observation of the graph. (2) Correlation curve: This method is generally used by professional investment companies when conducting in-depth research on assets; this method calculates the discrete local correlation coefficient between two time series and draws the correlation curve between the two, thereby visually refl...

Claims


Application Information

Patent Timeline
Patent Type & Authority Applications(China)
IPC IPC(8): G06Q40/04
CPCG06Q40/04
Inventor 王水王乐
Owner NINGBO DAHONGYING UNIV
Why Eureka
Try Eureka