Method and system for visual analysis of actual traffic demand correlation at intersections

An analysis method and technology of traffic demand, applied in the field of visual analysis of actual traffic demand at intersections, can solve problems such as difficulty in improvement, and achieve the effect of simplifying data retrieval

An analysis method and technology of traffic demand, applied in the field of visual analysis of actual traffic demand at intersections, can solve problems such as difficulty in improvement, and achieve the effect of simplifying data retrieval

CN109035773BActive Publication Date: 2021-04-30JIANGSU ZHITONG TRANSPORTATION TECH

Image

  • Method and system for visual analysis of actual traffic demand correlation at intersections
  • Method and system for visual analysis of actual traffic demand correlation at intersections
  • Method and system for visual analysis of actual traffic demand correlation at intersections

Examples


Embodiment

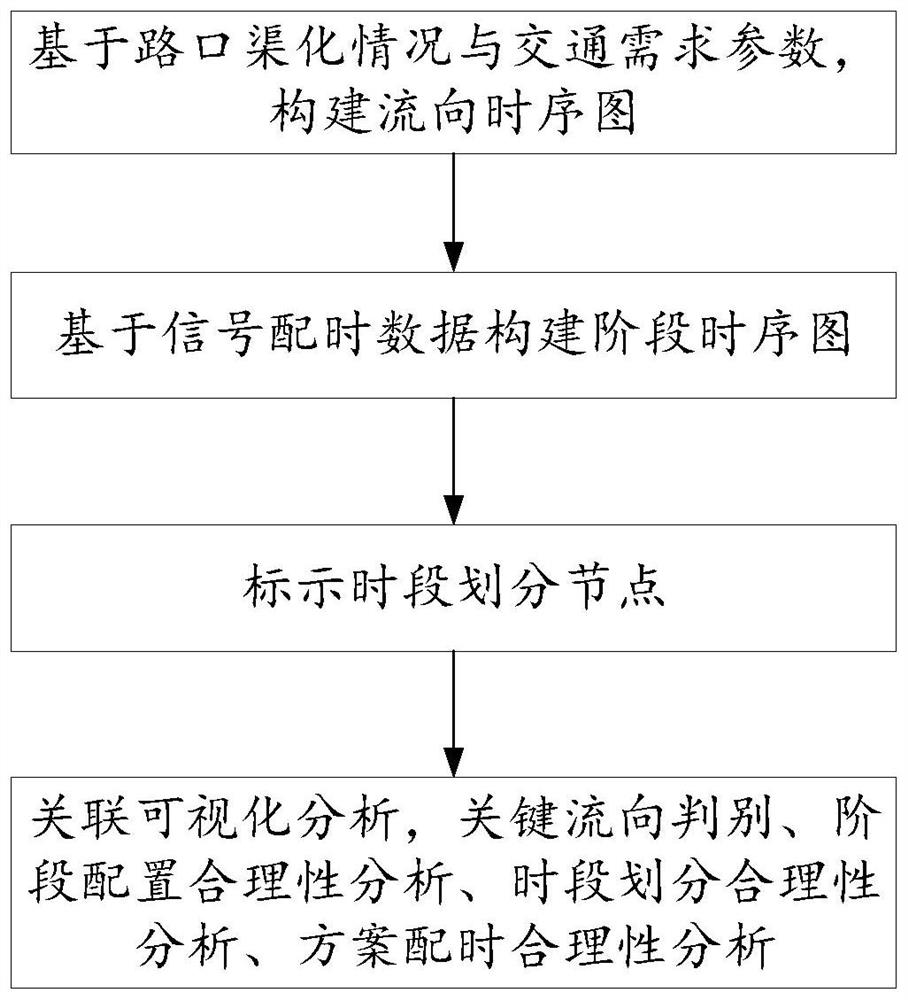
[0030] A visual analysis method for the correlation of actual traffic demand at intersections. Based on the actual traffic data at intersections and signal control timing data, an interactive visual chart is used to analyze the matching situation between traffic demand and signal timing schemes in each flow direction at the intersection, and then evaluate signal control. the rationale for the plan; figure 1 , including the following steps:

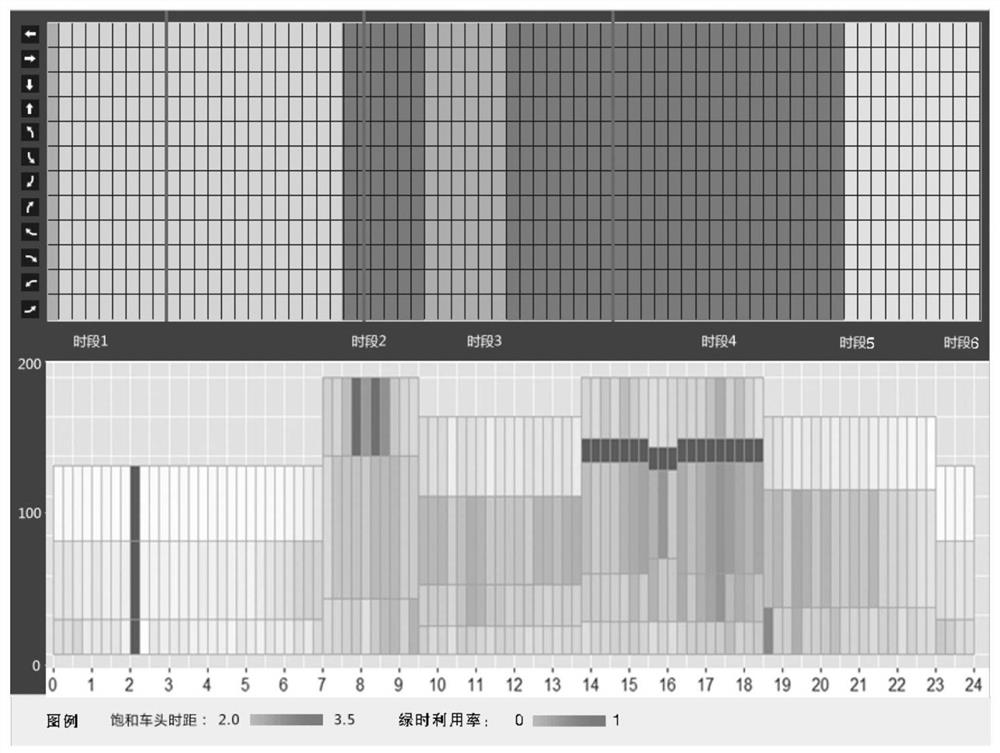
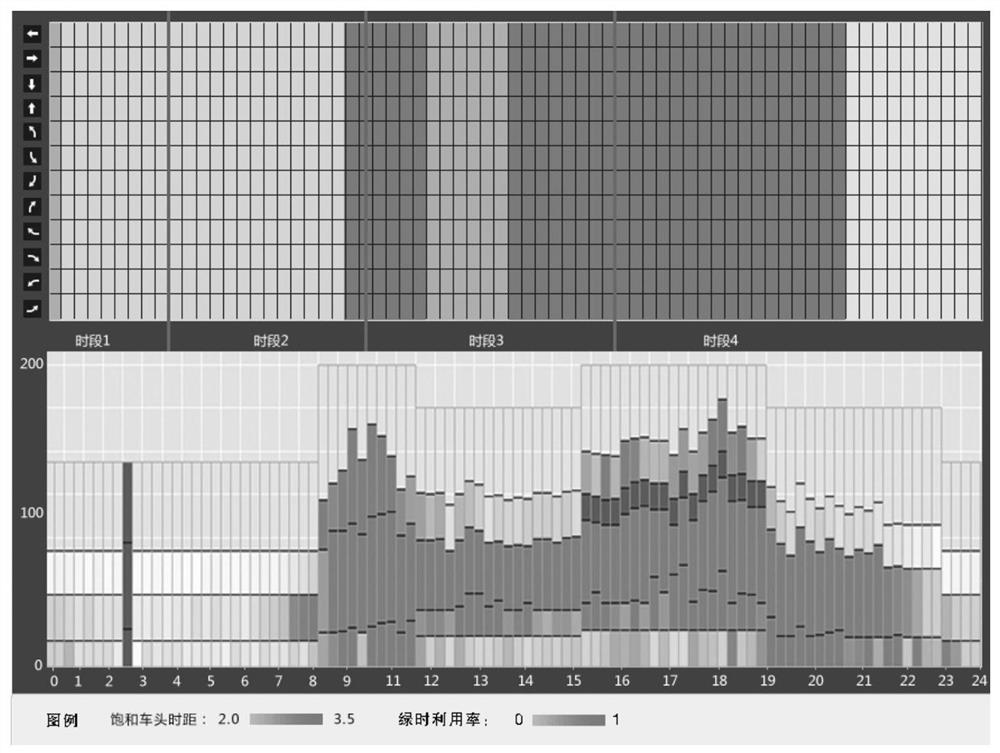
[0031] S1. Construct a flow time sequence diagram based on the channelization of the intersection, and divide the time axis into several time units according to the short time interval Ο„; the flow axis of the intersection includes turning left east, going straight east, turning right east, turning left west, going straight west, going west Turn right, turn left south, go straight south, turn right south, turn north left, go straight north, and turn north right, which are determined according to the actual channelization of the intersection...


PUM


Abstract

The present invention provides a correlation visualization analysis method and system for actual traffic demand at an intersection. Based on the actual traffic data at the intersection and signal control timing data, an interactive visual chart is used to analyze the matching situation between the traffic demand of each flow direction at the intersection and the signal timing scheme. , and then evaluate the rationality of the signal control scheme; the present invention can clearly present the actual traffic demand of each flow direction at the signal control intersection through an intuitive visualization method and flexible interaction, intuitively identify key flow directions, cooperate with the balance analysis of demand and supply, and identify signal Problems such as unreasonable timing, unreasonable stage configuration, and unreasonable division of time periods exist in the control plan.

Description

technical field [0001] The invention relates to a visual analysis method and system for actual traffic demand correlation at intersections. Background technique [0002] The root cause of road traffic congestion is the imbalance between traffic supply and demand. From a management point of view, restraining traffic demand or improving the efficiency of existing traffic systems has become an important means to deal with traffic congestion. Among them, traffic signal control plays an important role in improving road traffic efficiency. Effectiveness has gradually become the mainstream method to alleviate urban traffic congestion. However, in the case of congestion, many tests have shown that the control effect of the existing urban road traffic signal system is not good. One of the important reasons is that the effective matching between the supply and demand of the traffic system cannot be realized. [0003] At present, the traffic control department is mainly based on the m...

Claims


Application Information

Patent Timeline
30 Apr 2021
Publication
CN109035773B
IPC
G08G1/01
CPC
G08G1/0133; G08G1/0145
Inventors
徐佳ιͺ‹; ε•δΌŸιŸ¬