Method and device for generating line chart

A line graph and cost technology, applied to the generation method and device field of the line graph, can solve the problems of not being able to clearly inform the user of the profit and loss of the unit's position, difficult to know the profit and loss of the unit of goods, and inconvenience to the user

Inactive Publication Date: 2019-02-01
ADVANCED NEW TECH CO LTD
View PDF3 Cites 0 Cited by
  • Summary
  • Abstract
  • Description
  • Claims
  • Application Information

AI Technical Summary

Problems solved by technology

[0002] In the prior art, the total value curve of the commodity is usually used to reflect the change of the commodity value. However, the user can only know the change of the total value of the commodity through the total value curve, and it is difficult to know the profit and loss of the unit commodity. very inconvenient
[0003] In the corresponding s

Method used


Image

  • Method and device for generating line chart
  • Method and device for generating line chart
  • Method and device for generating line chart

Examples


Embodiment Construction

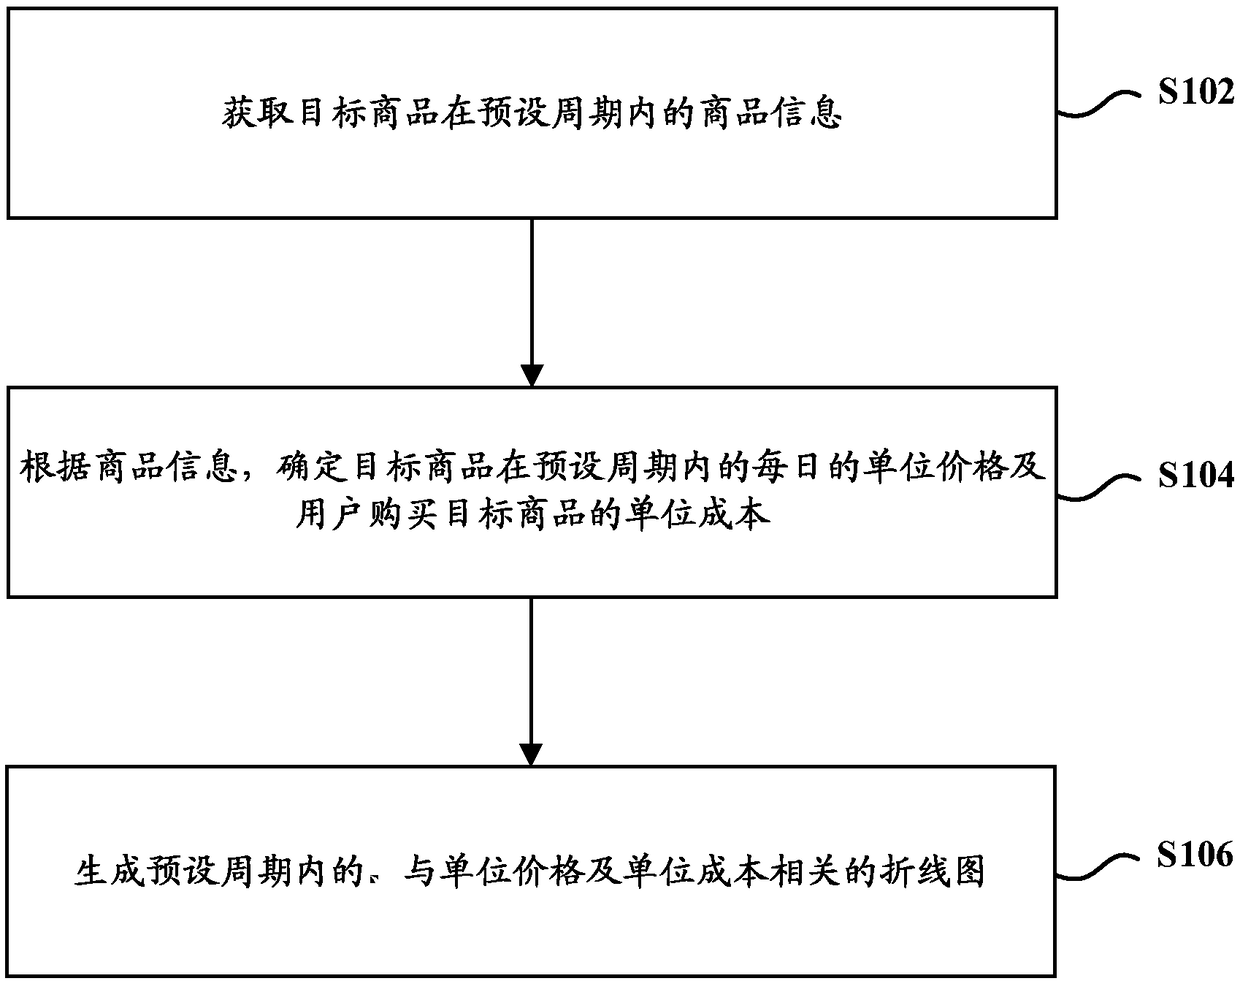
[0098] One or more embodiments of this specification provide a method and device for generating a line graph, which is used to automatically generate a line graph related to the unit price and unit cost of a product, so as to provide users with more product information.

[0099] In order to enable those skilled in the art to better understand the technical solutions in one or more embodiments of this specification, the following will describe the technical solutions in one or more embodiments of this specification in conjunction with the drawings in one or more embodiments of this specification The technical solution is clearly and completely described, and obviously, the described embodiments are only a part of the embodiments in this specification, rather than all the embodiments. Based on one or more embodiments of this specification, all other embodiments obtained by persons of ordinary skill in the art without creative efforts shall fall within the scope of protection of o...


PUM


Abstract

One or more embodiments of the present specification disclose a method and apparatus for generating a line chart for automatically generating a line chart related to a unit price and a unit cost of acommodity, thereby providing more commodity information to a user. The method comprises the following steps of: obtaining commodity information of a target commodity in a preset period; Determining adaily unit price of the target commodity and a unit cost of a user purchasing the target commodity within the preset period according to the commodity information; Wherein the unit price refers to a price for sale of a single target commodity, and the unit cost refers to an actual price for purchasing a single target commodity; Generating a line chart related to the unit price and the unit cost within the preset period.

Description

technical field [0001] This specification relates to the technical field of data processing, and in particular to a method and device for generating a line graph. Background technique [0002] In the prior art, the total value curve of the commodity is usually used to reflect the change of the commodity value. However, the user can only know the change of the total value of the commodity through the total value curve, and it is difficult to know the profit and loss of the unit commodity. Very inconvenient. [0003] In the corresponding specific scenarios, such as funds, the net value trend chart of the fund is usually used to reflect the changes in the fund's performance, and the cumulative profit and loss is used to show the changes in the profit and loss of the user's holdings of the fund, but neither of these can clearly inform the user of the profit and loss of the unit's holdings . Contents of the invention [0004] The purpose of one or more embodiments of this spe...

Claims


Application Information

Patent Timeline
IPC IPC(8): G06Q40/06G06F16/9038
CPCG06Q40/06
Inventor 黄起生
Owner ADVANCED NEW TECH CO LTD
Why Eureka
Try Eureka