
Visually approximating parallel coordinates data

a parallel coordinate and data technology, applied in the field of data visualization, can solve the problems of a large number of data quickly becoming overwhelming, and the graphical display can appear too crowded to make the display useful, so as to simplify the graphical representation of data and the volume of connections

Inactive Publication Date: 2015-07-16
HEWLETT-PACKARD ENTERPRISE DEV LP +1
View PDF2 Cites 8 Cited by
  • Summary
  • Abstract
  • Description
  • Claims
  • Application Information

AI Technical Summary

Benefits of technology

The technology described in this patent allows for visualization of large amounts of data in a way that makes it easier to understand. Rather than showing every line between coordinate lines, multiple lines are grouped together and represented with fewer graphical elements. This simplifies the display while still providing information about the data. The data is organized into bins and the volume of connections between bins can be represented using lines of varying width or opacity based on the volume of data in the bin. This technology makes it easier to analyze and visualize large amounts of data.

Problems solved by technology

This can be helpful to identify data values in another format, but can quickly become overwhelming with a large number of data points
When large amounts of data are displayed in parallel coordinates, the graphical display can appear too crowded to make the display useful.

Method used


Image

  • Visually approximating parallel coordinates data
  • Visually approximating parallel coordinates data
  • Visually approximating parallel coordinates data

Examples


Embodiment Construction

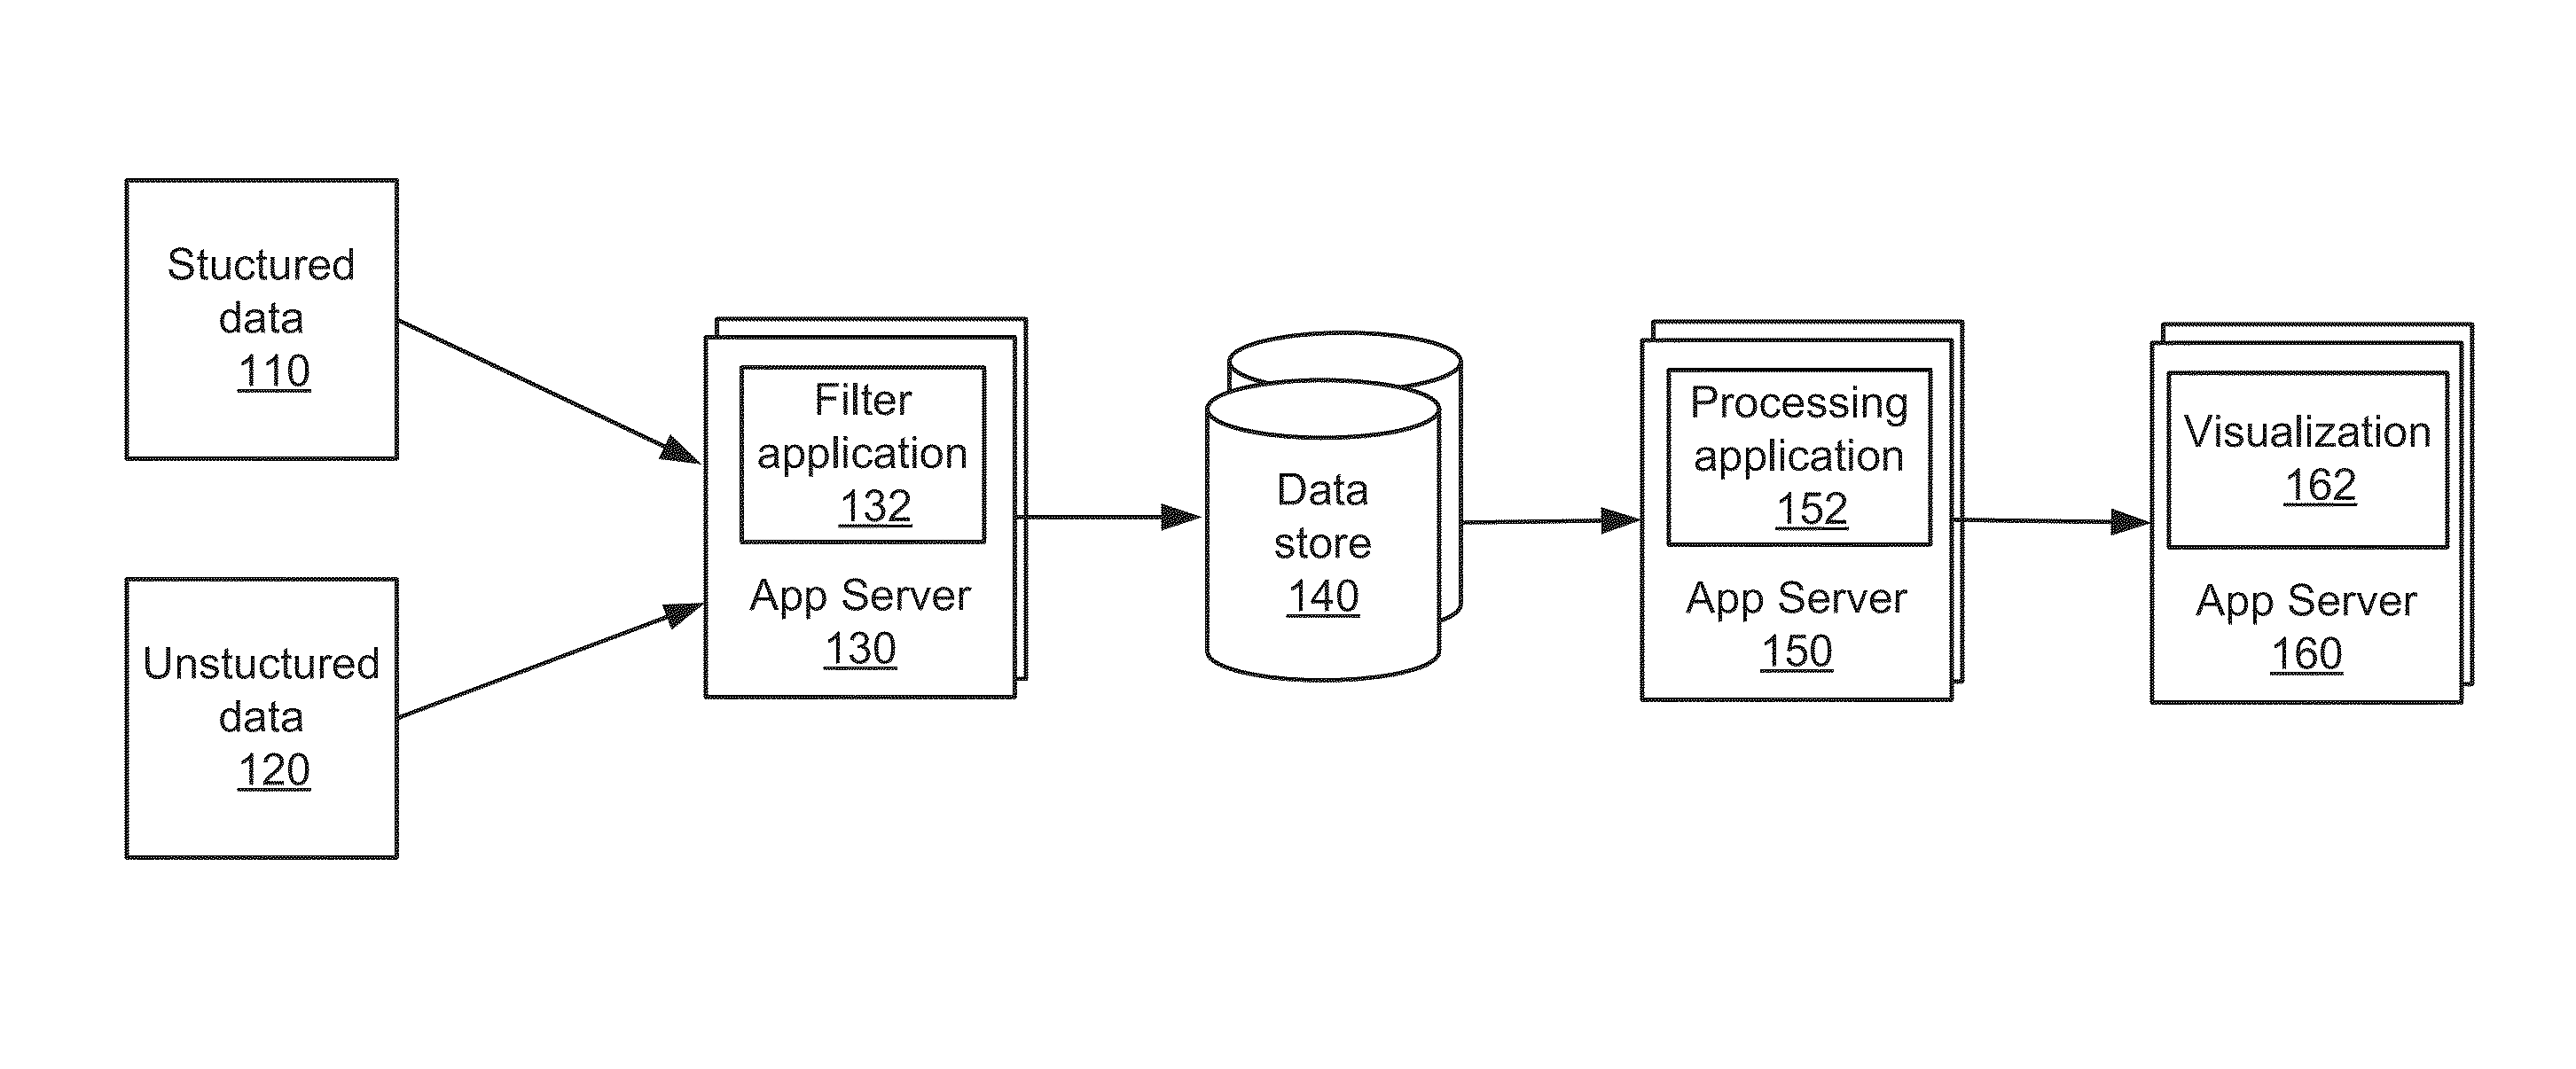
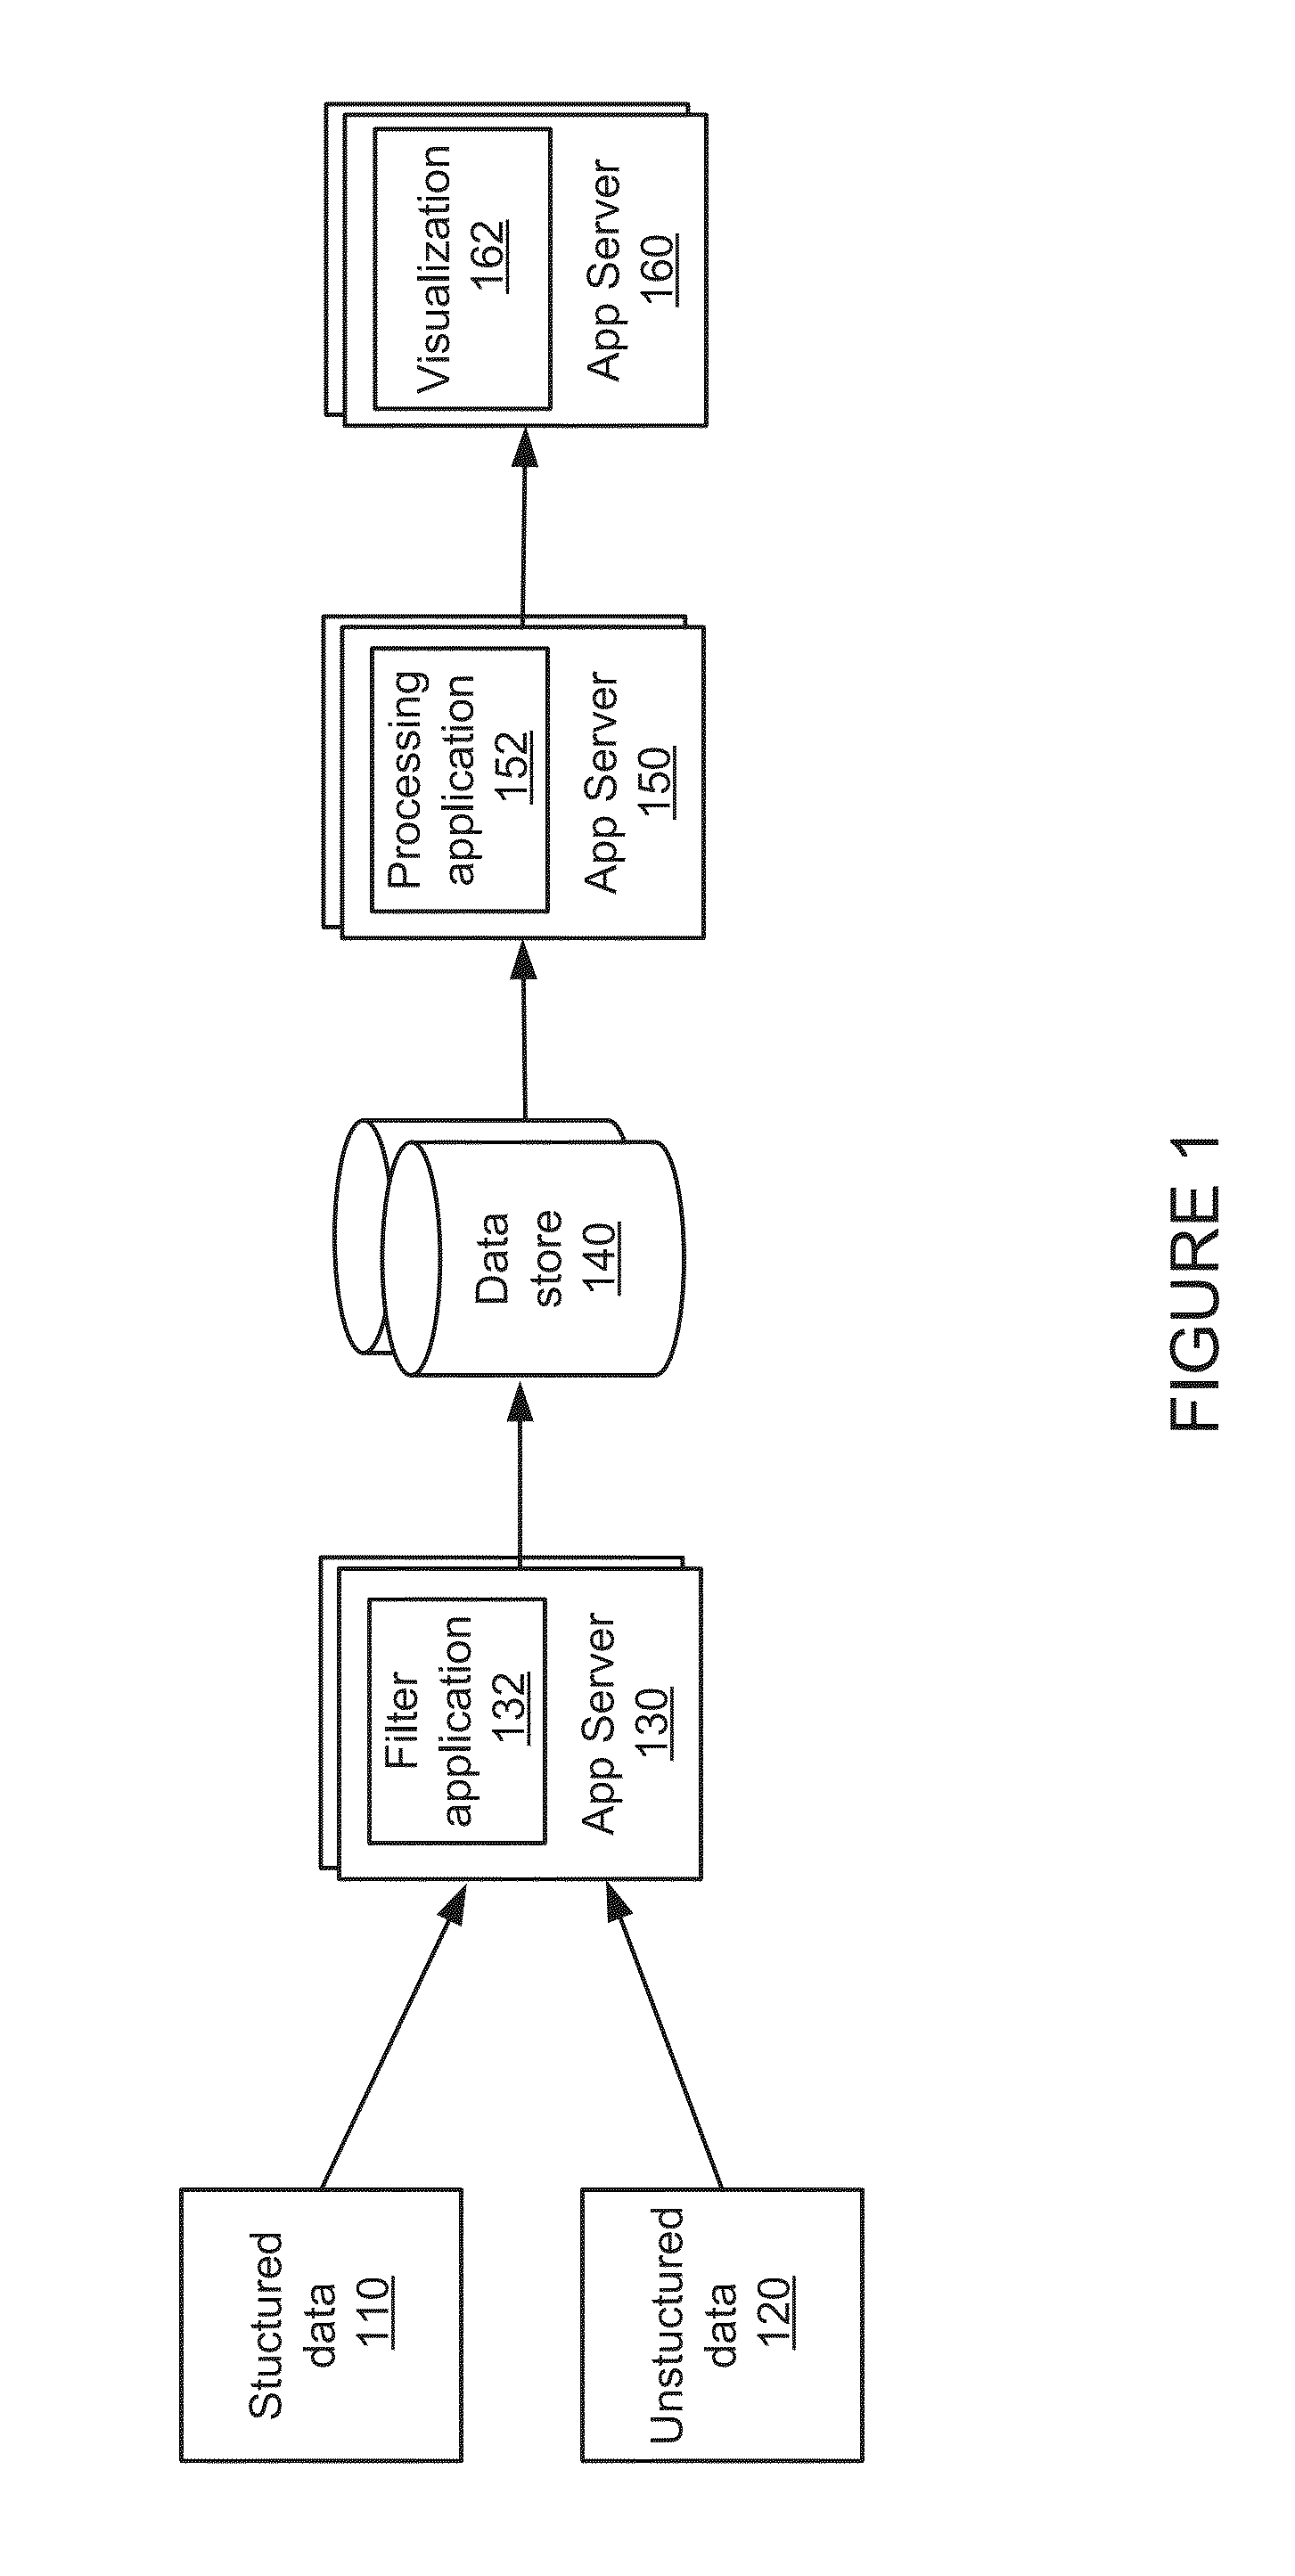
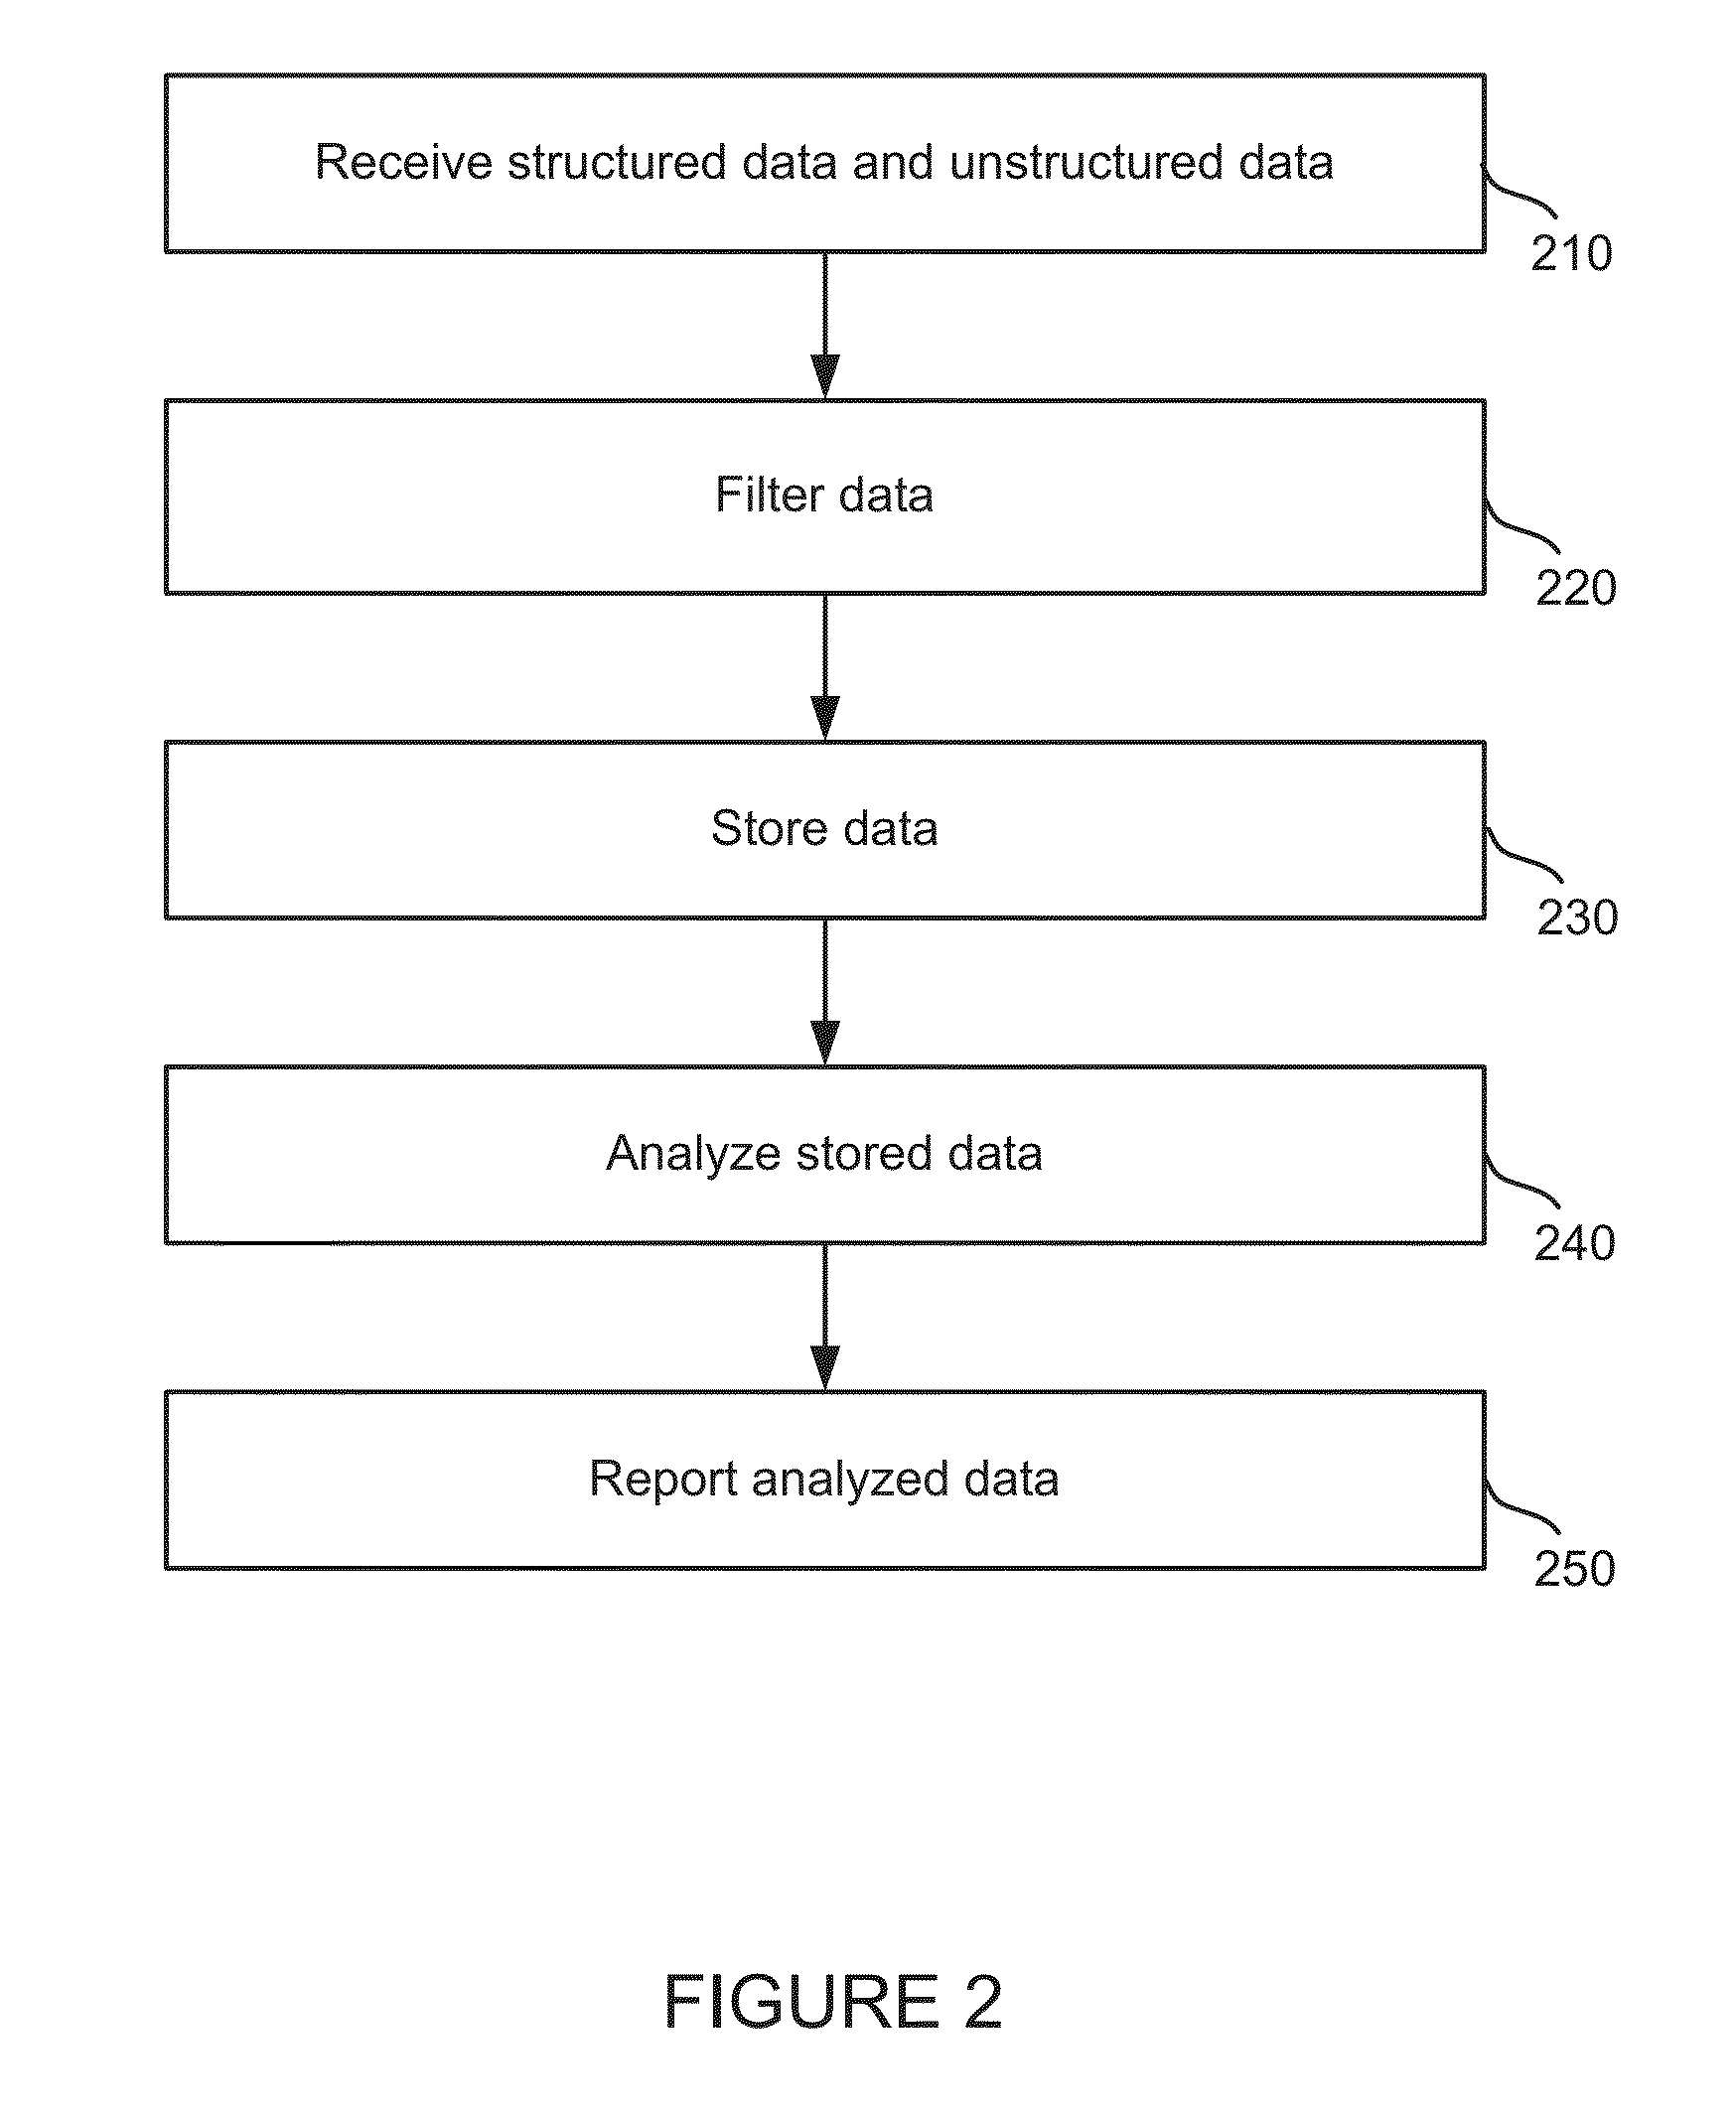
[0019]The present technology may provide data visualization with the capability of viewing large amounts of data in a parallel coordinates system. Parallel coordinates typically display lines between two or more vertical lines representing a coordinate element. When large amounts of data are displayed in parallel coordinates, the graphical display can appear too crowded to make the display useful. Rather than displaying each and every line between coordinate lines, multiple lines may be grouped together and represented with fewer graphical elements. The fewer graphical elements simplify the graphical representation of the data while still providing information about the density or volume of data occupying a particular space. Bins are determined for each axis. The number of data points extending between neighboring parallel coordinates are then identified for each bin. Each neighboring bin pair that includes one or more connecting data point will include a graphical representation, s...


PUM


Abstract

A data visualization system with the capability of viewing large amounts of data in a parallel coordinates system. Large amounts of data are displayed in parallel coordinates by grouping together data points by bins and representing grouped data with fewer graphical elements. The fewer graphical elements simplify the graphical representation of the data while still providing information about the density or volume of data occupying a particular space. Bins are determined for each axis. The volume of connections between a pair of neighboring pair of bins may be represented by modifying an aspect of the connection based on the volume.

Description

BACKGROUND[0001]1. Field of the Invention[0002]The present invention relates to visualization of data. In particular, the present invention relates to multi-dimensional data visualization.[0003]2. Description of the Prior Art[0004]Visualization of data in three dimensional graphs can be helpful to understand the data. An example of a three dimensional graph is a plot of data on multiple axis, such as a three dimensional horizontal, vertical, and another axis coming towards or away from the point of view of a viewer. Three dimensional coordinate graphics are sometimes translated into parallel coordinates. This can be helpful to identify data values in another format, but can quickly become overwhelming with a large number of data points[0005]With big data applications becoming increasingly popular, there is a need to display large amounts of data in multiple formats in order to better understand the relationships of the data. What is needed is an improved visualization interface for ...

Claims


Application Information

Patent Timeline
Patent Type & Authority Applications(United States)
IPC IPC(8): G06F17/30G06F3/0484
CPCG06F3/04842G06F17/30604G06T11/206G06F16/904G06F16/288
Inventor HANSEN, MARC
Owner HEWLETT-PACKARD ENTERPRISE DEV LP
Learn More