Automated data extraction from scatter plot images

a data extraction and scatter plot technology, applied in image data processing, image enhancement, instruments, etc., can solve the problems of preventing a completely automated extraction of data from scatter, affecting the accuracy of data extraction, so as to achieve high accuracy the position of data points and increase performance.

Active Publication Date: 2017-12-07
THINK CELL SOFTWARE
View PDF7 Cites 31 Cited by
  • Summary
  • Abstract
  • Description
  • Claims
  • Application Information

AI Technical Summary

Benefits of technology

[0016]The accuracy of identifying individual data points in a plot and of identifying the data series a data point belongs to may be greatly increased. In particular, the method may be much more robust against data point detection errors and data series assignment errors which may result from an overlap of two or more data points of the same or of different data series. For example in case a clustering algorithm is applied on the plot for identifying the data points and their respective series in a single clustering step, the problem arises that overlapping data points may be erroneously identified as a new type of data point symbol and as a new type of data series. This may be prevented by identifying templates which respectively comprise a (single) data point symbol (of the data series represented by said template), and then using said templates in a further, separate step for identifying the actual data points (data series instances).
[0140]Embodiments of the present invention may enable users to extract source data from plot images. The method according to embodiments of the invention may automatically identify a set of components (“pixel sets”) of such data plots (such as data points, axes labels, chart titles, series names, and the like), and may allow users to manually adjust, remove components from, or add components to the identified set of components (pixel sets) to form an updated set of components (updated pixel set). The updated set of components is then extracted to a data grid, and enable a user to view the data within the data grid, to update or edit the data in the data grid, and to generate one or more additional views or charts of the data in the data grid.

Problems solved by technology

Entering said data manually can be cumbersome and error prone, in particular for large scatter plots comprising dozens or even hundreds of data points.
The complexity and diversity of digital scatter plots has hitherto precluded a completely automated extraction of data from scatter plots.
Existing programs for digitizing plot images do not fully-automatically extract data points and / or fully-automatically identify plot axes.
Further, these programs do not automatically identify the maximum and minimum values of axes ranges.
Finally, these programs do not automatically identify chart titles, series names, or axes labels.
It is therefore not possible to quickly and accurately extract data from plot images using existing programs.
For example in case a clustering algorithm is applied on the plot for identifying the data points and their respective series in a single clustering step, the problem arises that overlapping data points may be erroneously identified as a new type of data point symbol and as a new type of data series.
Especially on devices with small displays and / or with touch-input only, it is hard to select chart elements precisely by hand.
However, as only a “red triangle template” and a “black circle template” are generated and used for identifying data series instances in the plot, the risk of erroneously identifying data points of a further data series may greatly be decreased.
However, the above mentioned filtering step may not remove (all) blobs which represent an overlay of two or more data point symbols or which represent other image objects and artifacts having a similar size and / or appearance like a data point symbol, so these template candidates may remain as potential sources of error.

Method used


Image

  • Automated data extraction from scatter plot images
  • Automated data extraction from scatter plot images
  • Automated data extraction from scatter plot images

Examples


Embodiment Construction

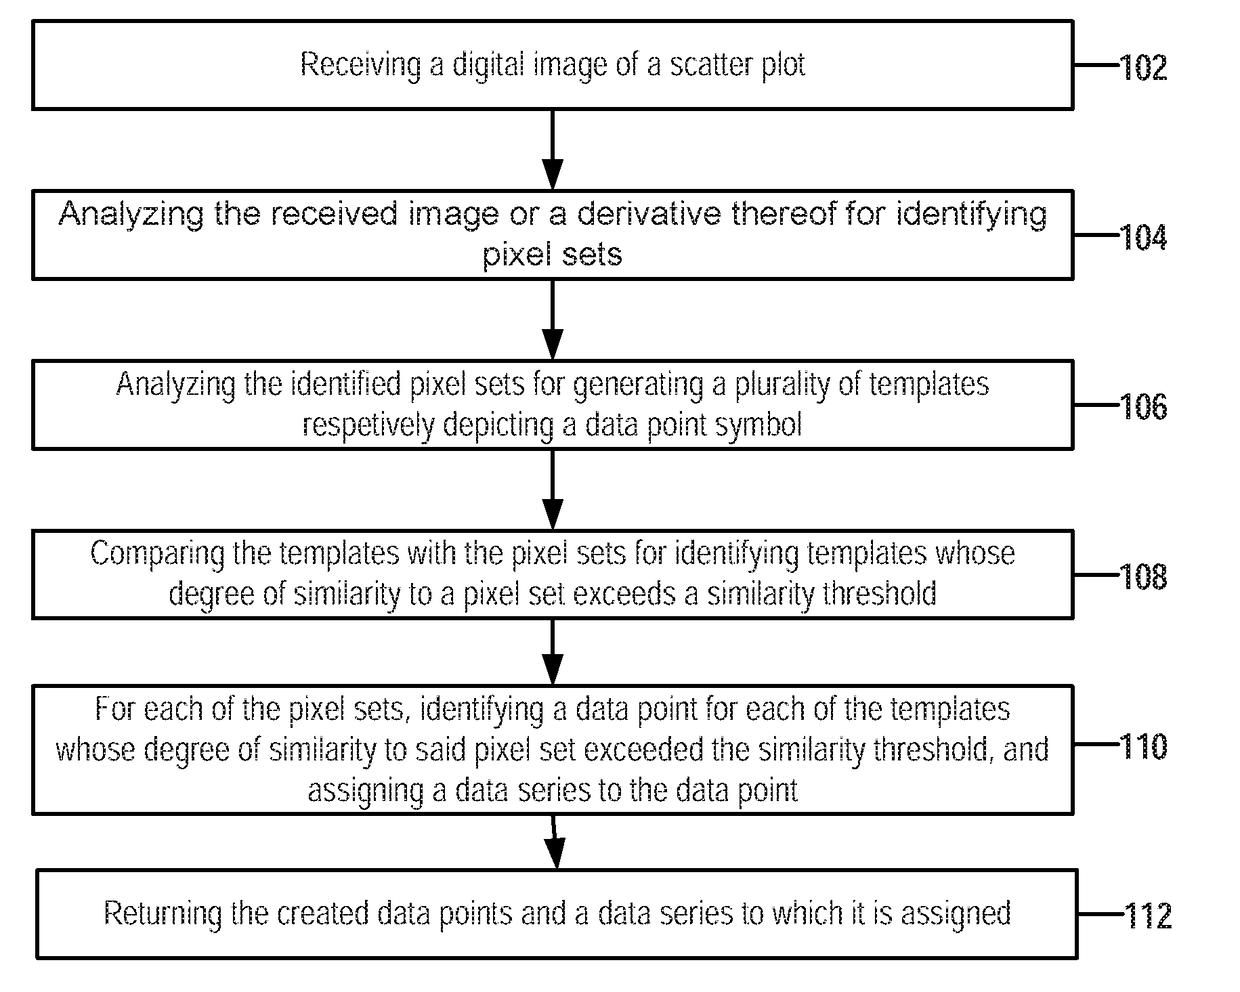
[0149]A “plot” or “chart” as used herein is a graphical representation of data, e.g. of data points, belonging to one or more data series. A chart can be, in particular, a scatter plot.

[0150]The term “coloring” as used herein refers to the color, shading, and / or intensity gradient of one or more pixels. In combination with other visual features such as morphological features, size and / or shape, the coloring may be used for identifying multiple instances of the same data point symbol or for determining a template that matches completely or partially with a pixel set or an image patch.

[0151]A “pixel structure”, e.g. a template pixel structure, is a set of pixel that may have any shape. For example, a pixel structure can be a pixel matrix or a circle filled with pixels, a polygon or any other shape that is fully or partially filled with pixels.

[0152]A “chart image” or “plot image” as used herein is a digital image that depicts a chart. A plot image can be used as input for extracting d...


PUM


Abstract

The invention relates to a computer-implemented method for automatically extracting data from a scatter plot. The method comprises receiving a digital image of a scatter plot; analyzing the received digital image for identifying a plurality of pixel sets, each pixel set being a group of adjacent pixels; analyzing the pixel sets in the received image or in a derivative of the received image for generating a plurality of templates; comparing the templates with pixels of a target image for identifying matching templates; identifying data points for the identified similar templates; assigning to each identified data point a data series; and returning the identified data points.

Description

CROSS-REFERENCE TO RELATED APPLICATIONS[0001]This U.S. Non-Provisional application claims benefit under 35 USC §119 to U.S. Provisional Application No. 62 / 346,544 filed on Jun. 6, 2016 in the USPTO, the entire contents of which is incorporated by reference in its entirety.FIELD OF THE INVENTION[0002]This application relates generally to the field of data processing, and more particularly to the extraction of data from scatter plot images.BACKGROUND AND RELATED ART[0003]To simplify the understanding, data is typically represented graphically in all kinds of electronic as well as paper-based media. For example, charts are commonly used for presenting data on web pages, online- and print magazines. Charts depicted in print media can be digitized by capturing the chart with a camera or a scanning device for providing a digital representation of the chart. A large variety of different chart types exists, e.g. bar charts, pie charts, doughnut charts or the like. Charts of a particular typ...

Claims


Application Information

Patent Timeline
Patent Type & Authority Applications(United States)
IPC IPC(8): G06F17/30G06K9/46G06K9/00G06K9/68G06T7/13G06V10/44
CPCG06F17/30256G06K9/4604G06T7/13G06K9/00456G06K9/6892G06T2207/10024G06T2207/20076G06T2207/30176G06T7/74G06T7/11G06T7/12G06T7/155G06V30/413G06V30/422G06V10/44G06F16/5838G06V30/1988
Inventor LAHMANN, DOMINIKSCHOEDL, ARNORINGENBERG, JORDAN
Owner THINK CELL SOFTWARE
Why Eureka
Try Eureka