Method and system for displaying an image instead of data

a technology of image and data, applied in the field of information display, can solve the problems of limiting the options of conventional systems, limiting the user's ability to customize the visual representation of data, adding more, etc., and achieve the effect of quick and easy visual identification

Inactive Publication Date: 2007-04-17
MICROSOFT TECH LICENSING LLC
View PDF6 Cites 51 Cited by
  • Summary
  • Abstract
  • Description
  • Claims
  • Application Information

AI Technical Summary

Benefits of technology

[0005]The present invention solves the above problems by displaying graphical indicators instead of text or numeric data based on user-defined conditions. By representing data with an image, graphical indicators can provide quick and easy visual identification of data highlighting or categorization chosen by the user. This invention can replace numeric and textual data, which typically requires significant mental analysis to evaluate, with quickly recognizable graphical indicators for identifying status, trends, or groupings. The user can specify conditions for displaying graphical indicators instead of numeric or text data by defining test parameters and replacement images.
[0006]The graphical indicators can be images that are pre-assigned (as part of specifying the conditions) and then dynamically applied based on the underlying text or numeric data value. Graphical indicators can allow the user to visually represent data types or categories with graphics, based on the user's conditions. Different conditions can be specified for a given data field and each condition can be associated with a particular graphical indicator. Prioritized processing of data conditions can allow for complex control of which indicator will be displayed to visually represent the data. When the underlying data in a field changes, the criteria can be reapplied and the field dynamically updated to the appropriate indicator.

Problems solved by technology

Although this has made information more identifiable, the options have been limited.
Conventional systems do not allow the user to customize the visual representation of data.
These color-coded reporting options do not offer the user any control in defining data categories, adding more categories, or displaying different colors or types of images.
Prior stoplight reports have not allowed a user to associate indicators with different types of data, such as showing a purple flag for employees whose last name begins with A to G, a yellow bubble for ages between 30 and 65, and a blue smiley face for U.S. citizens.

Method used


Image

  • Method and system for displaying an image instead of data
  • Method and system for displaying an image instead of data
  • Method and system for displaying an image instead of data

Examples


Embodiment Construction

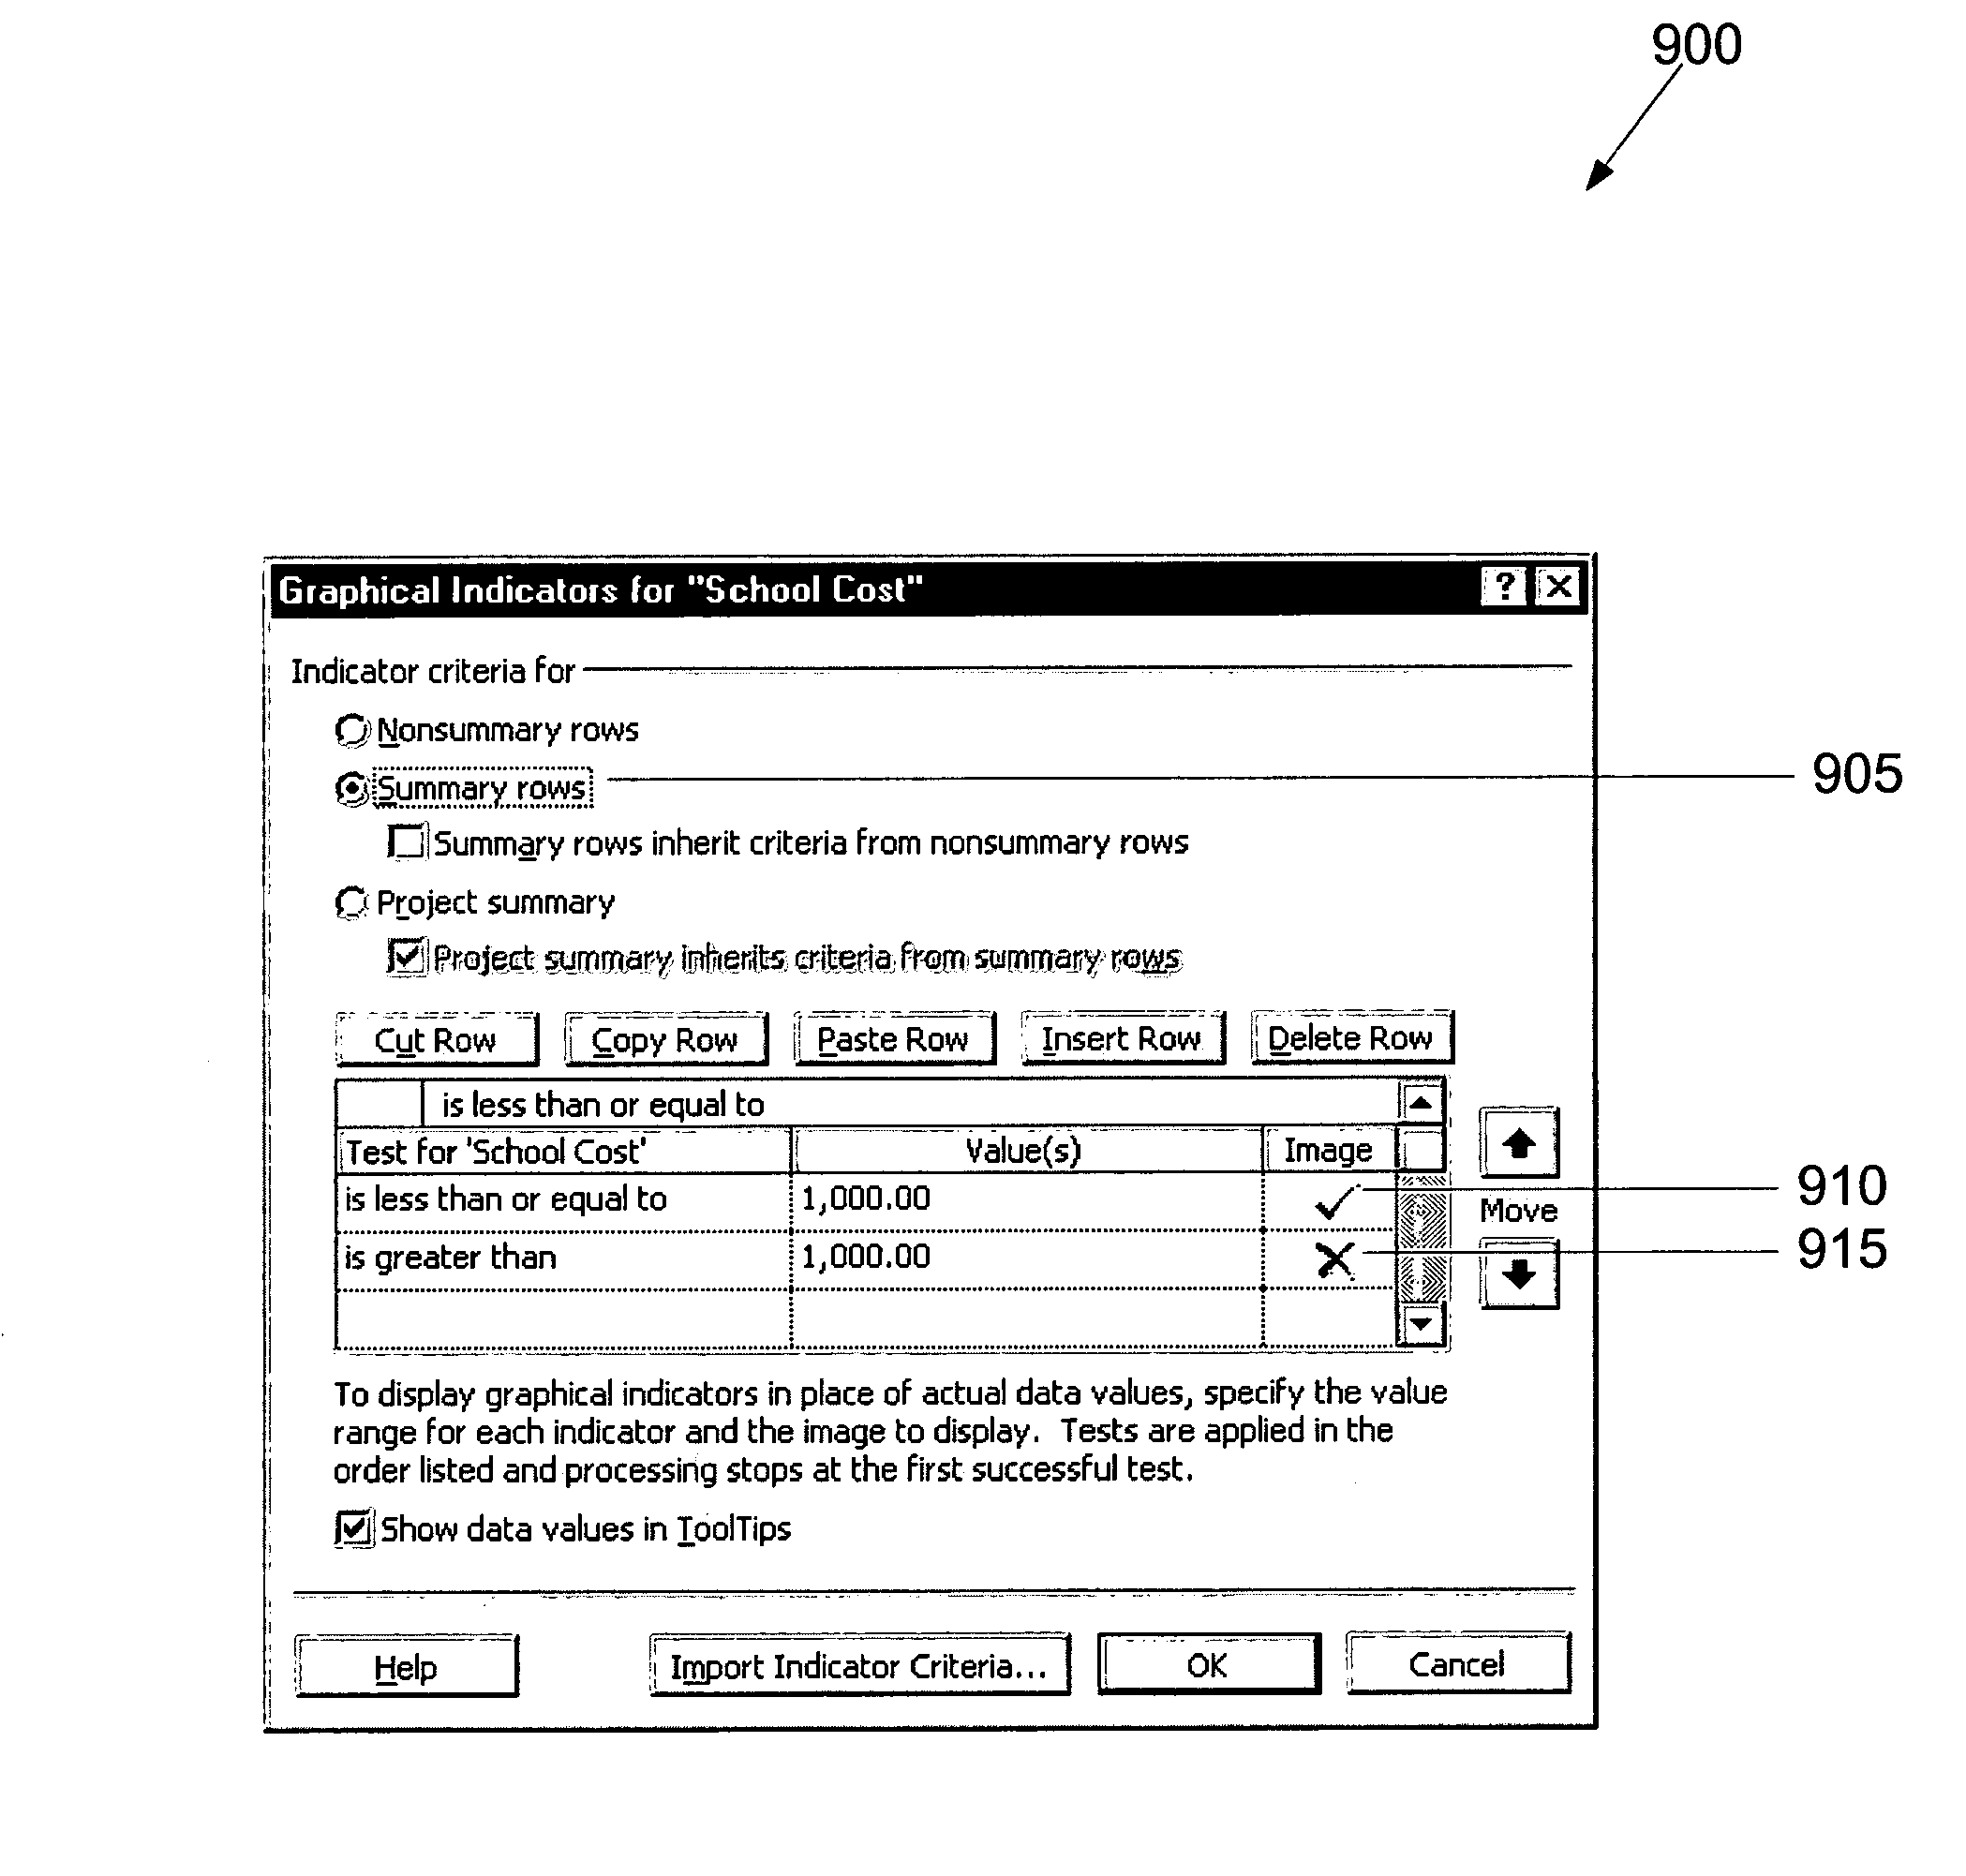
[0022]The present invention provides a method and system for displaying graphical indicators, instead of data, based on user-defined conditions. By representing data with an image, graphical indicators provide quick and easy visual identification of whatever data highlighting or categorization the user chooses. This invention takes numeric and textual data, which requires significant mental analysis to evaluate, and replaces the data with quickly recognizable graphical indicators for identifying status, trends, or groupings. The user can specify conditions for displaying graphical indicators instead of actual data by defining test parameters, values, and images.

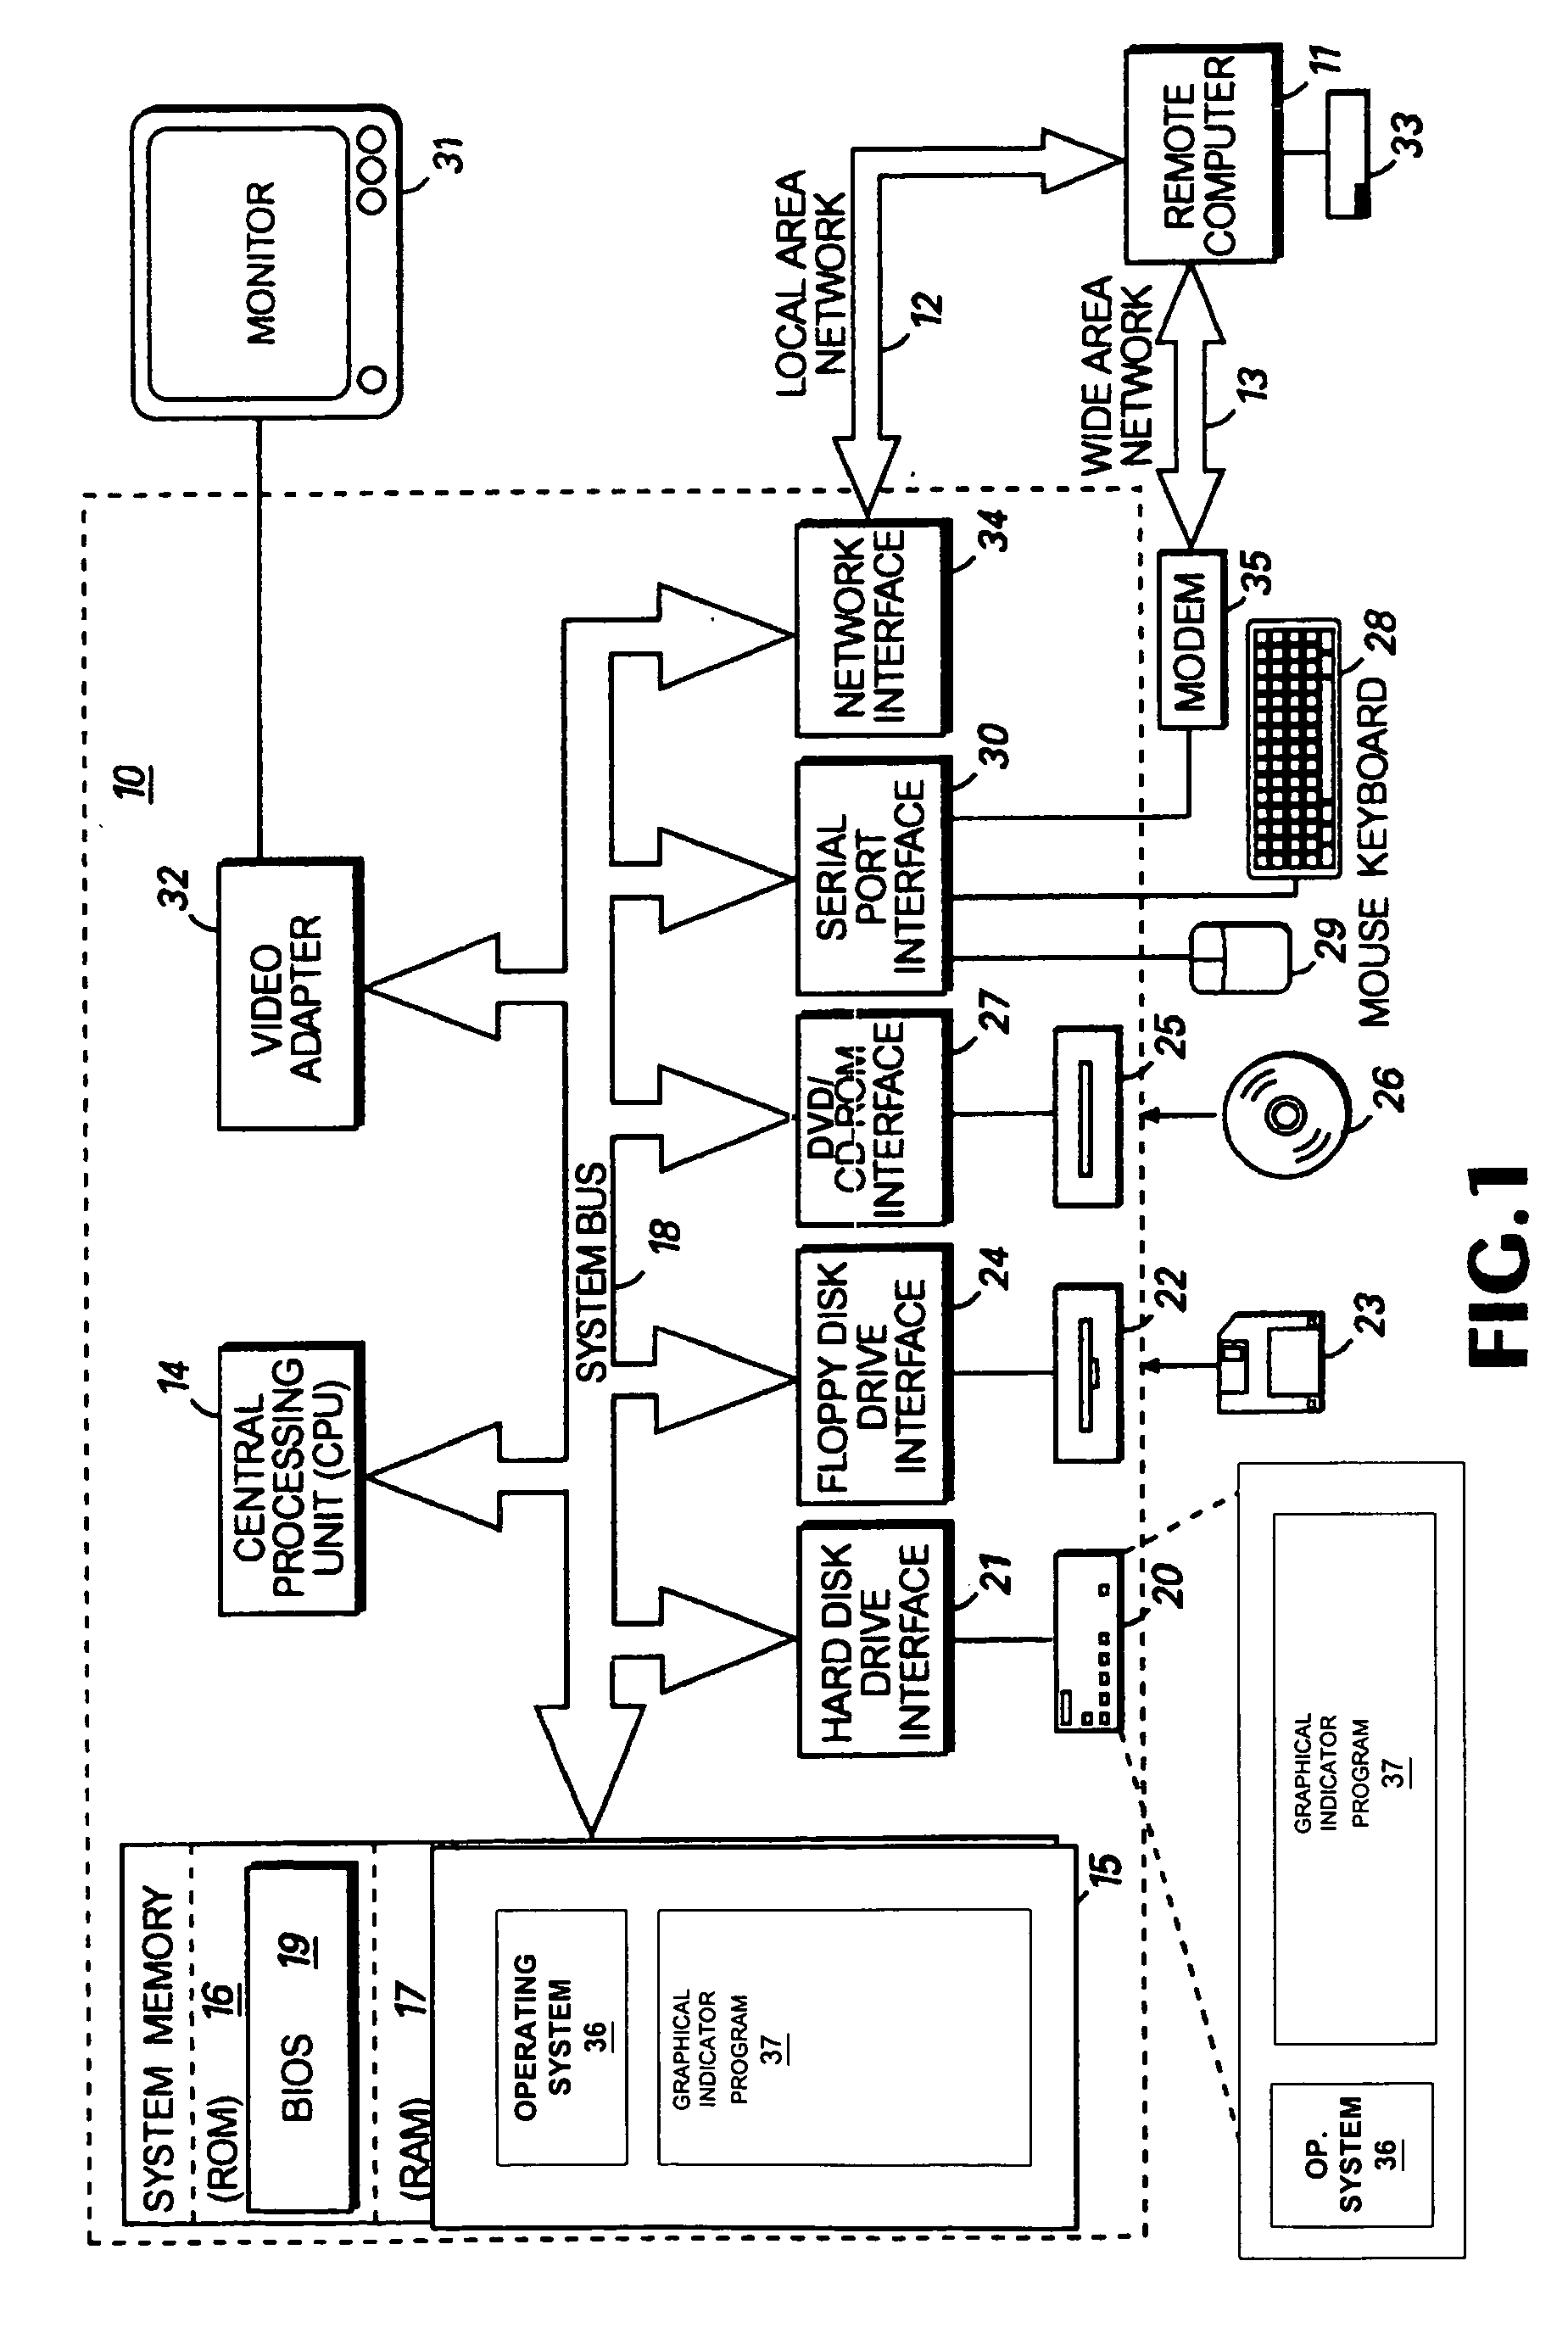
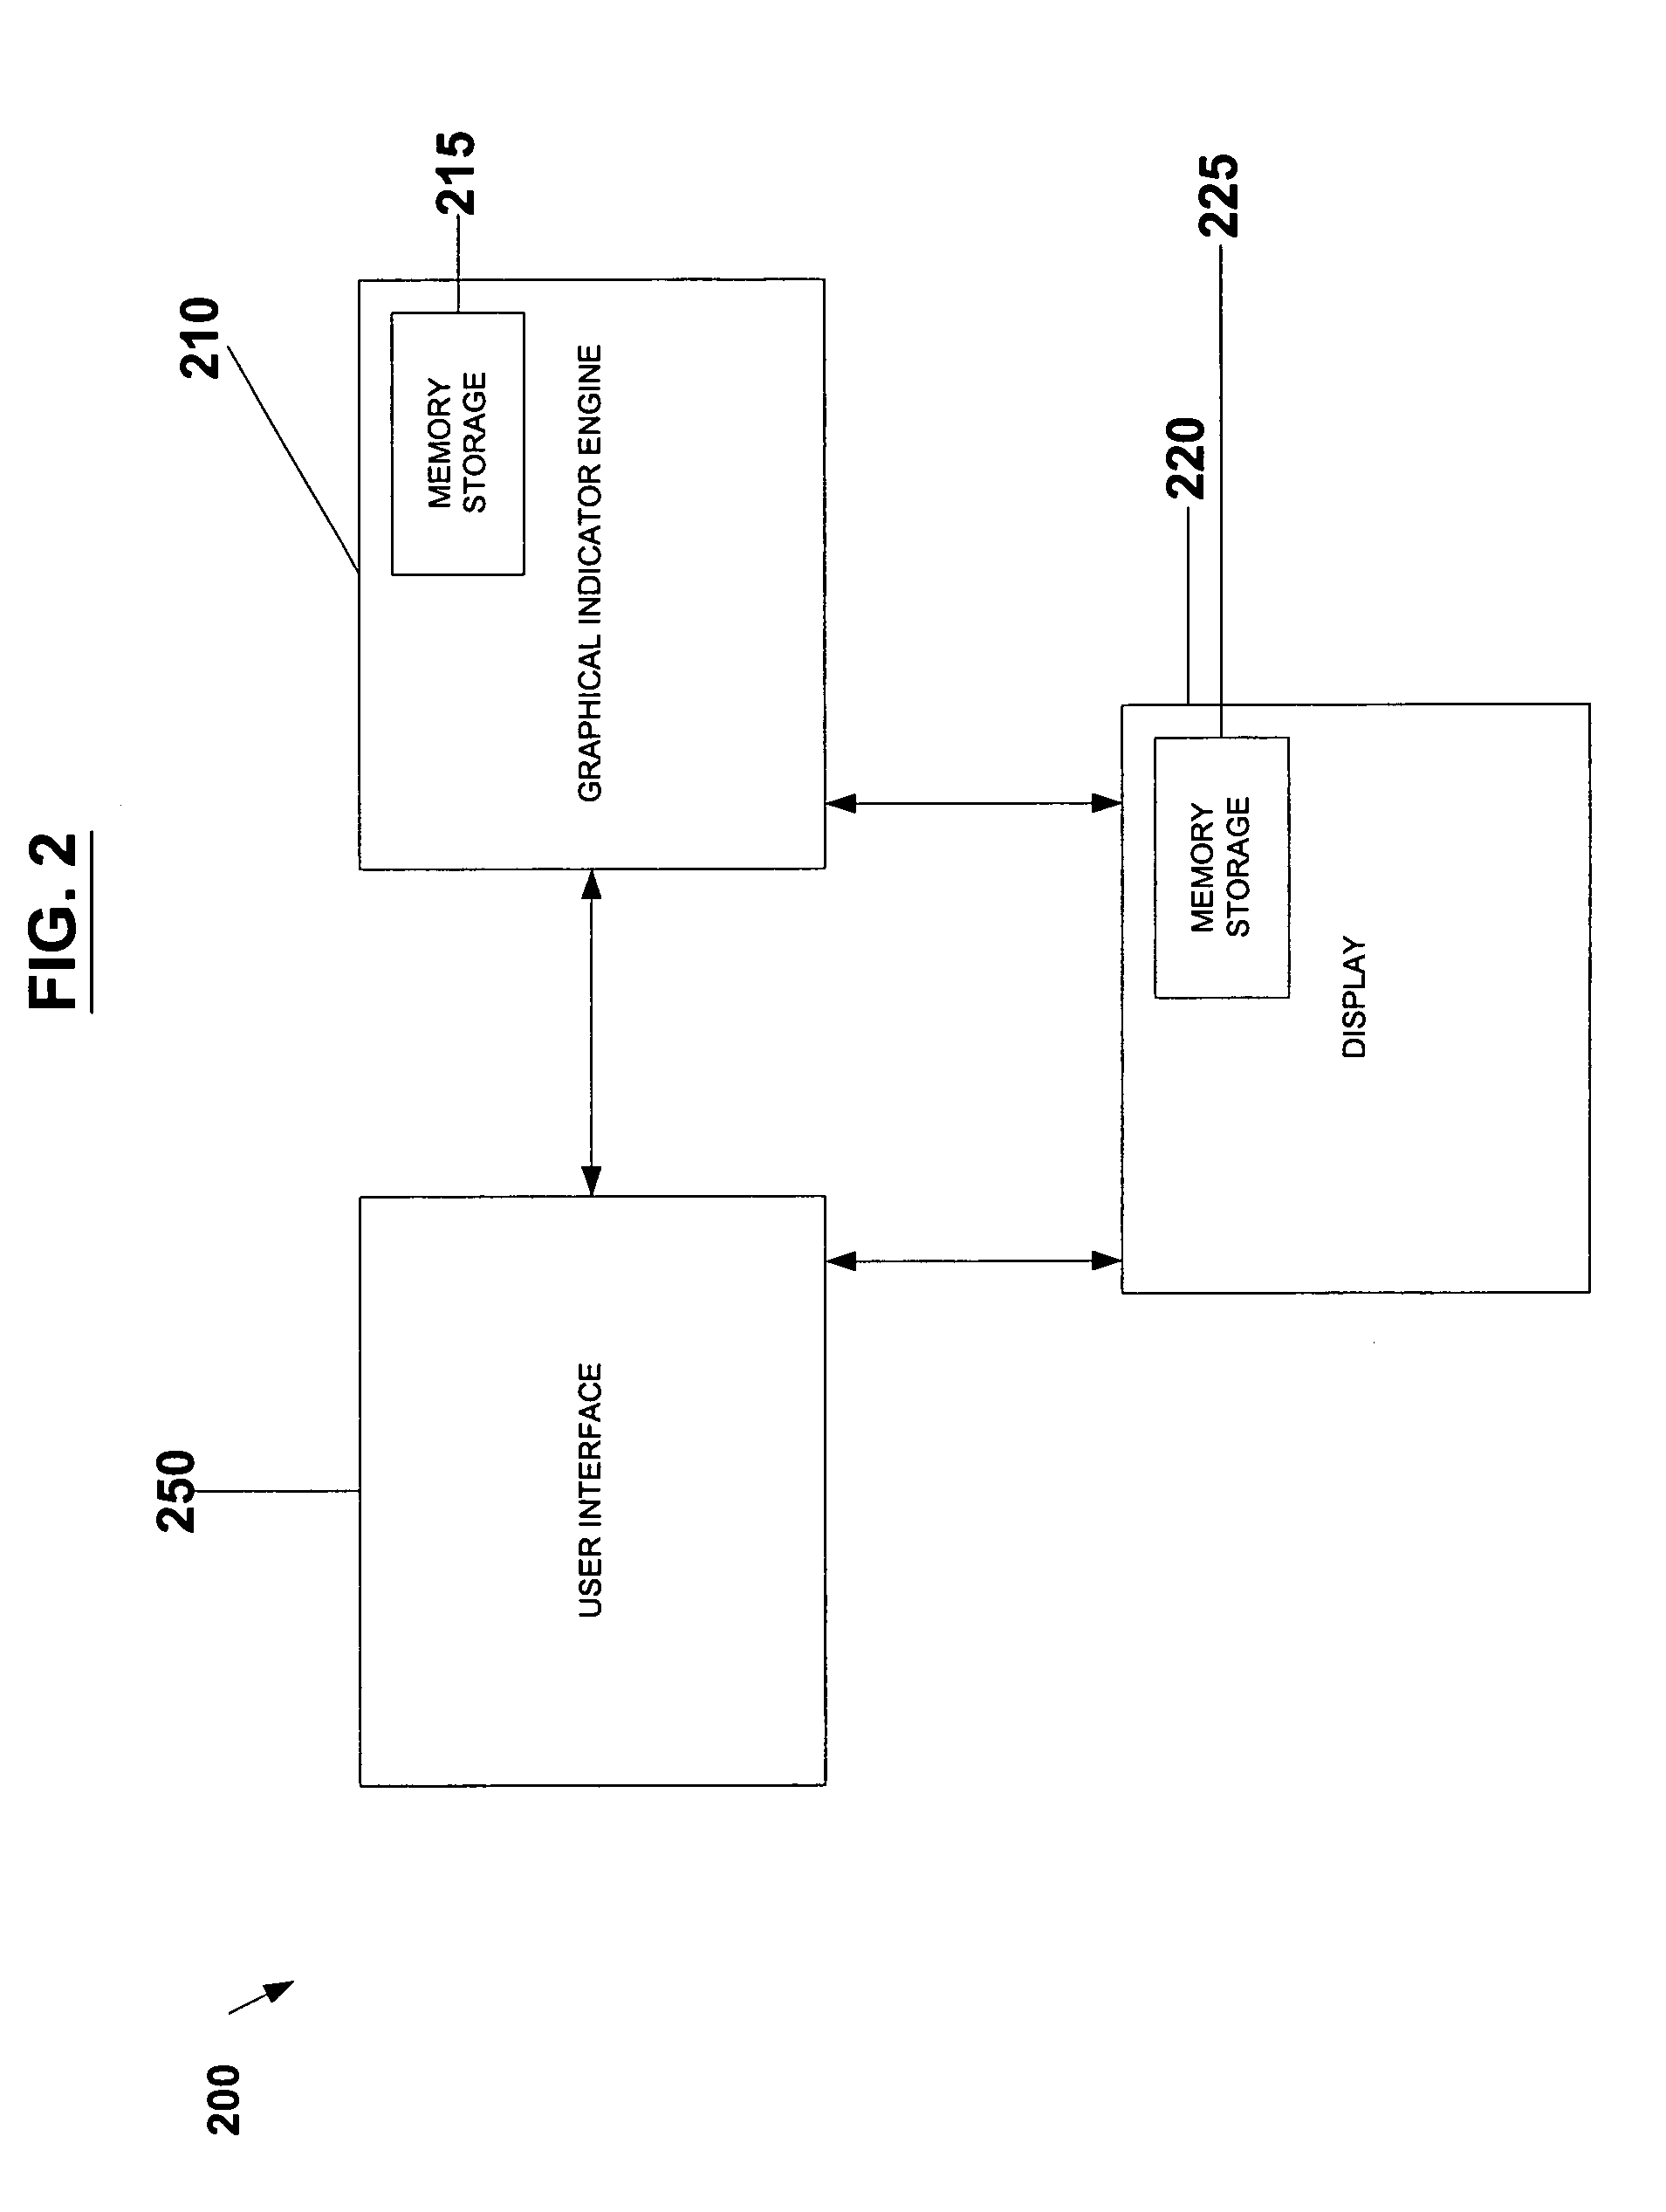
[0023]FIG. 1 is a block diagram of a personal computer that provides an exemplary operating environment. FIG. 2 is a block diagram illustrating internal objects. FIGS. 3–6 are flow diagrams illustrating exemplary methods for displaying graphical indicators, instead of data, based on user-defined conditions. FIGS. 7–10 are scr...


PUM


Abstract

Displaying graphical indicators, instead of data, based on user-defined conditions. The user can specify conditions for displaying graphical indicators instead of actual data by specifying a test, values, and an image. The graphical indicators can be pre-assigned images that are dynamically applied based on the underlying text or numeric data values. Graphical indicators allow the user to visually represent data types or categories with graphics, based on the user's conditions. Different conditions can be specified for a given data field and each condition can be associated with a particular graphical indicator. Prioritized processing of data conditions allow for complex control of which indicator will be displayed to visually represent the data. When the underlying data in a field changes, the criteria can be reapplied and the field dynamically updated to the appropriate indicator.

Description

TECHNICAL FIELD[0001]The present invention relates to the display of information in a project status report. More specifically, the invention relates to displaying an image in place of data, based on user-defined criteria, to assist the quick visual analysis of data.BACKGROUND OF THE INVENTION[0002]As computer programs have advanced in the project management field, color-coded project status reporting has been used to provide quick and easy visual identification of data highlighting or categorization. Although this has made information more identifiable, the options have been limited. Color-coded project status reporting has only allowed a user to display pre-defined images. Conventional systems do not allow the user to customize the visual representation of data.[0003]“Stoplight reports” or other color-coded project status reports typically show a green indicator for items on track, a yellow indicator for items at risk, and a red indicator for items in trouble. These color-coded re...

Claims


Application Information

Patent Timeline
Patent Type & Authority Patents(United States)
IPC IPC(8): G06F17/00
CPCG06Q10/06G06Q40/00
Inventor AAMODT, JEFFREY R.LEVIN, DAVID E.SNAPKAUSKAS, DARIUSBENTSEN, BRETT A.
Owner MICROSOFT TECH LICENSING LLC
Why Eureka
Try Eureka