Apparatus and methods of visualizing numerical benchmarks

a numerical benchmark and applicability technology, applied in the field of numerical benchmarks, can solve the problems of difficult and time-consuming interpretation of this information, difficult to visualize exactly what the general performance of the business is, and difficult to understand this information in full

Active Publication Date: 2009-08-04
SAP AG
View PDF10 Cites 12 Cited by
  • Summary
  • Abstract
  • Description
  • Claims
  • Application Information

AI Technical Summary

Benefits of technology

[0008]In accordance with the invention, as embodied and broadly described herein, methods and systems consistent with the principles of the invention provide for visualizing numerical benchmarks to interpret performance of a business, comprising accessing information relating to general performance of a business in relation to an industry wherein the information includes a business ratio value, an industry lower quartile value, an industry median value and an industry upper quartile value; processing the information; and creating a display, including in the display the lower quartile value, the median value, and the upper quartile value of the industry wherein the business ratio value is indicated in relation to the industry lower quartile value, industry median value, and industry upper quartile value and further including in the display at least one reference demarcation regarding a performance of the business in relation to the industry.

Problems solved by technology

Understanding this information in full can be a tedious process with the tools that are currently available.
However, interpreting this information can be difficult and time consuming.
Further, it can be difficult to visualize exactly what the general performance of the business, in light of these ratios, is in relation to its industry.

Method used


Image

  • Apparatus and methods of visualizing numerical benchmarks
  • Apparatus and methods of visualizing numerical benchmarks
  • Apparatus and methods of visualizing numerical benchmarks

Examples


Embodiment Construction

[0021]Reference will now be made in detail to the principles of the invention, examples of which are illustrated in the accompanying drawings. Wherever possible, the same reference numbers will be used throughout the drawings to refer to the same or like parts.

[0022]Overview

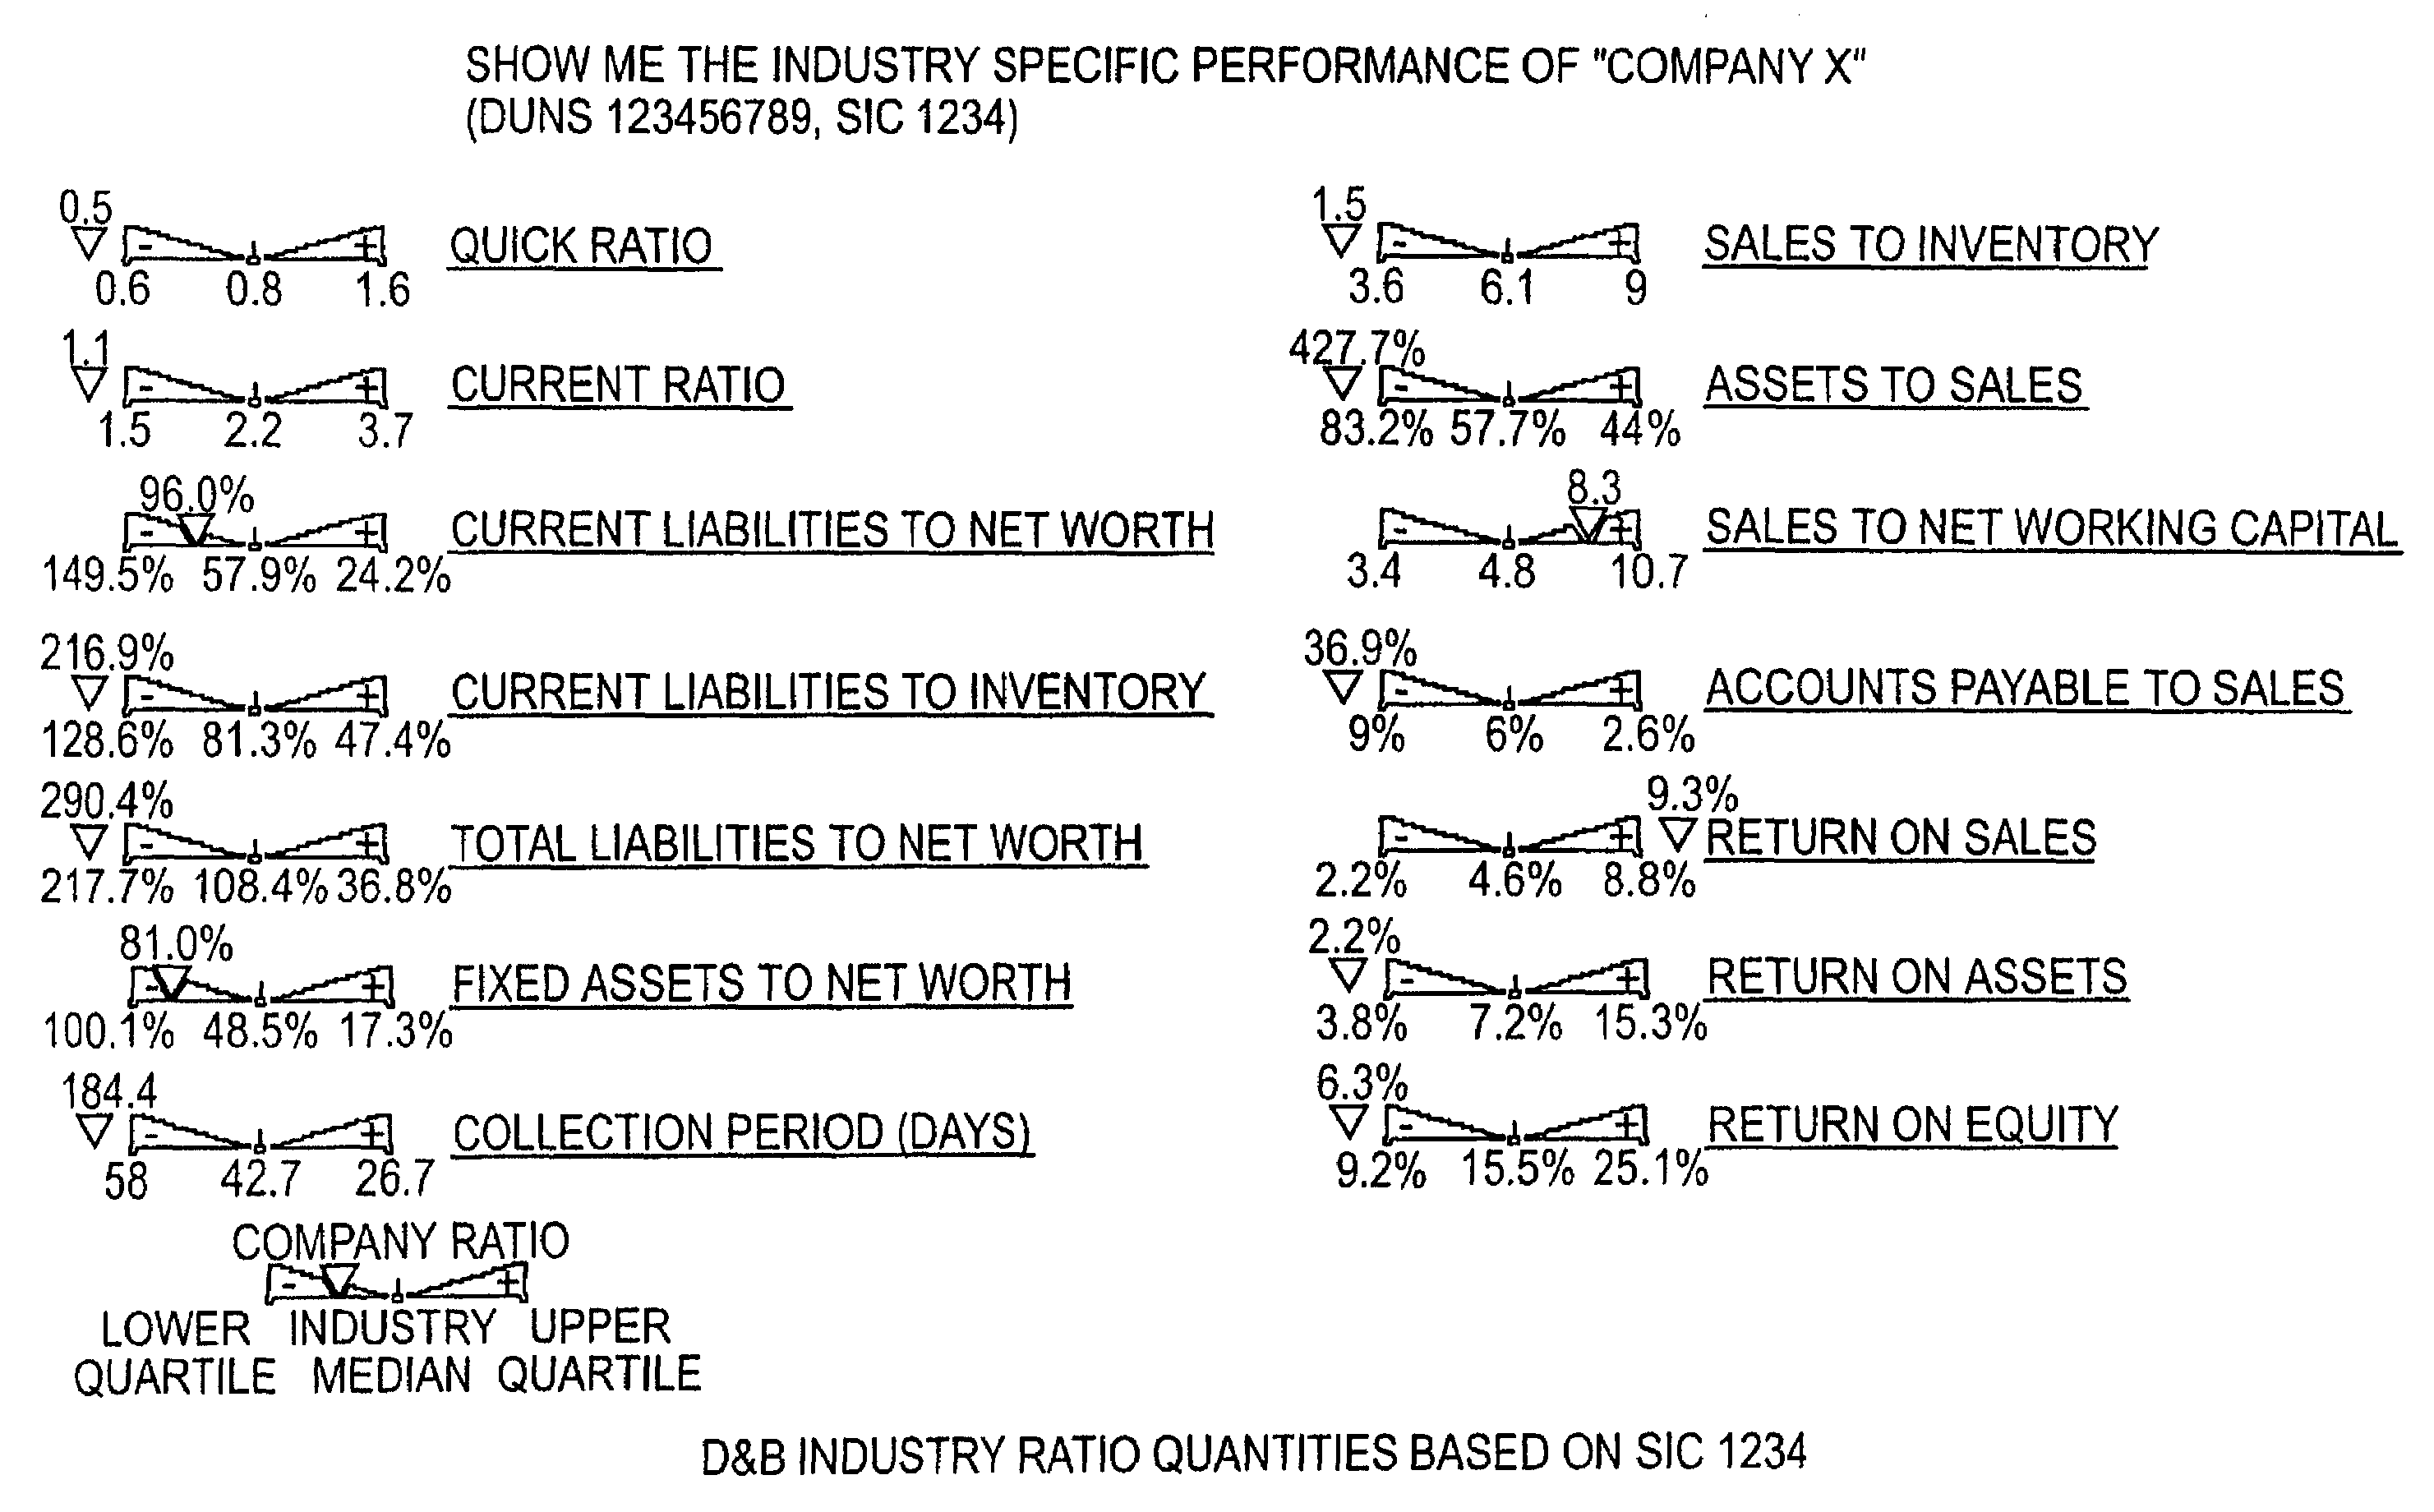
[0023]The present invention relates generally to methods for visualizing numerical benchmarks. The present invention can relate to visualizing any form of numerical benchmark and its referral to business performance is merely exemplary. Methods and apparatus consistent with the present invention can provide for creating a display containing information relating to the general performance of a business in relation to its industry. The display incorporates the lower quartile value, the median value, and the upper quartile value of an industry. The display further incorporates the business ratio value and indications of whether the business ratio value demonstrates good performance or poor performance of the busines...


PUM


Abstract

Methods and apparatus for visualizing numerical benchmarks are disclosed, wherein a display containing information relating to the general performance of a business in relation to its industry is created. The display incorporates the lower quartile value, the median value, and the upper quartile value of an industry. The display further incorporates the business ratio value. The display further includes indications of whether the business ratio value demonstrates good performance or poor performance of the business in relation to its industry. Thus, a user viewing the display can determine what a particular business' general performance is in relation to the lower quartile value, median value, and upper quartile value of its industry.

Description

RELATED APPLICATION DATA[0001]This application is related to and claims priority to U.S. Provisional Application No. 60 / 202,383, filed May 4, 2000, entitled “Method of Visualizing Complex Benchmarks,” which is expressly incorporated herein by reference in its entirety.BACKGROUND OF THE INVENTION[0002]1. Field of the Invention[0003]This invention relates generally to numerical benchmarks, and more specifically, to methods and systems for visualizing numerical benchmarks.[0004]2. Description of Related Art[0005]When conducting any type of business transaction today, it is important to understand what the general performance of a business is in relation to its industry. For example, Dun & Bradstreet, a business data provider, provides information that relates to the general performance of a business, including the fourteen “business ratios”. These ratios are known in the art of benchmarking as described below. Understanding this information in full can be a tedious process with the too...

Claims


Application Information

Patent Timeline
Patent Type & Authority Patents(United States)
IPC IPC(8): G06Q40/00G06Q10/00
CPCG06Q10/04G06Q40/00G06Q40/06G06Q40/04G06Q40/025G06Q40/03
Inventor EBERT, PETER STEFFEN
Owner SAP AG
Why Eureka
Try Eureka