
Financial activity with graphical user interface based on natural peril events

a technology of financial activity and graphical user interface, applied in the field of financial activities, can solve problems such as inability to predict with exact certainty, impose potentially significant financial burdens arising from property damage, and do not provide any coverage for the outside areas of a home or business. to achieve the effect of boosting governmental financial assistan

Active Publication Date: 2010-08-24
WEATHER RISK SOLUTIONS
View PDF324 Cites 46 Cited by
  • Summary
  • Abstract
  • Description
  • Claims
  • Application Information

AI Technical Summary

Benefits of technology

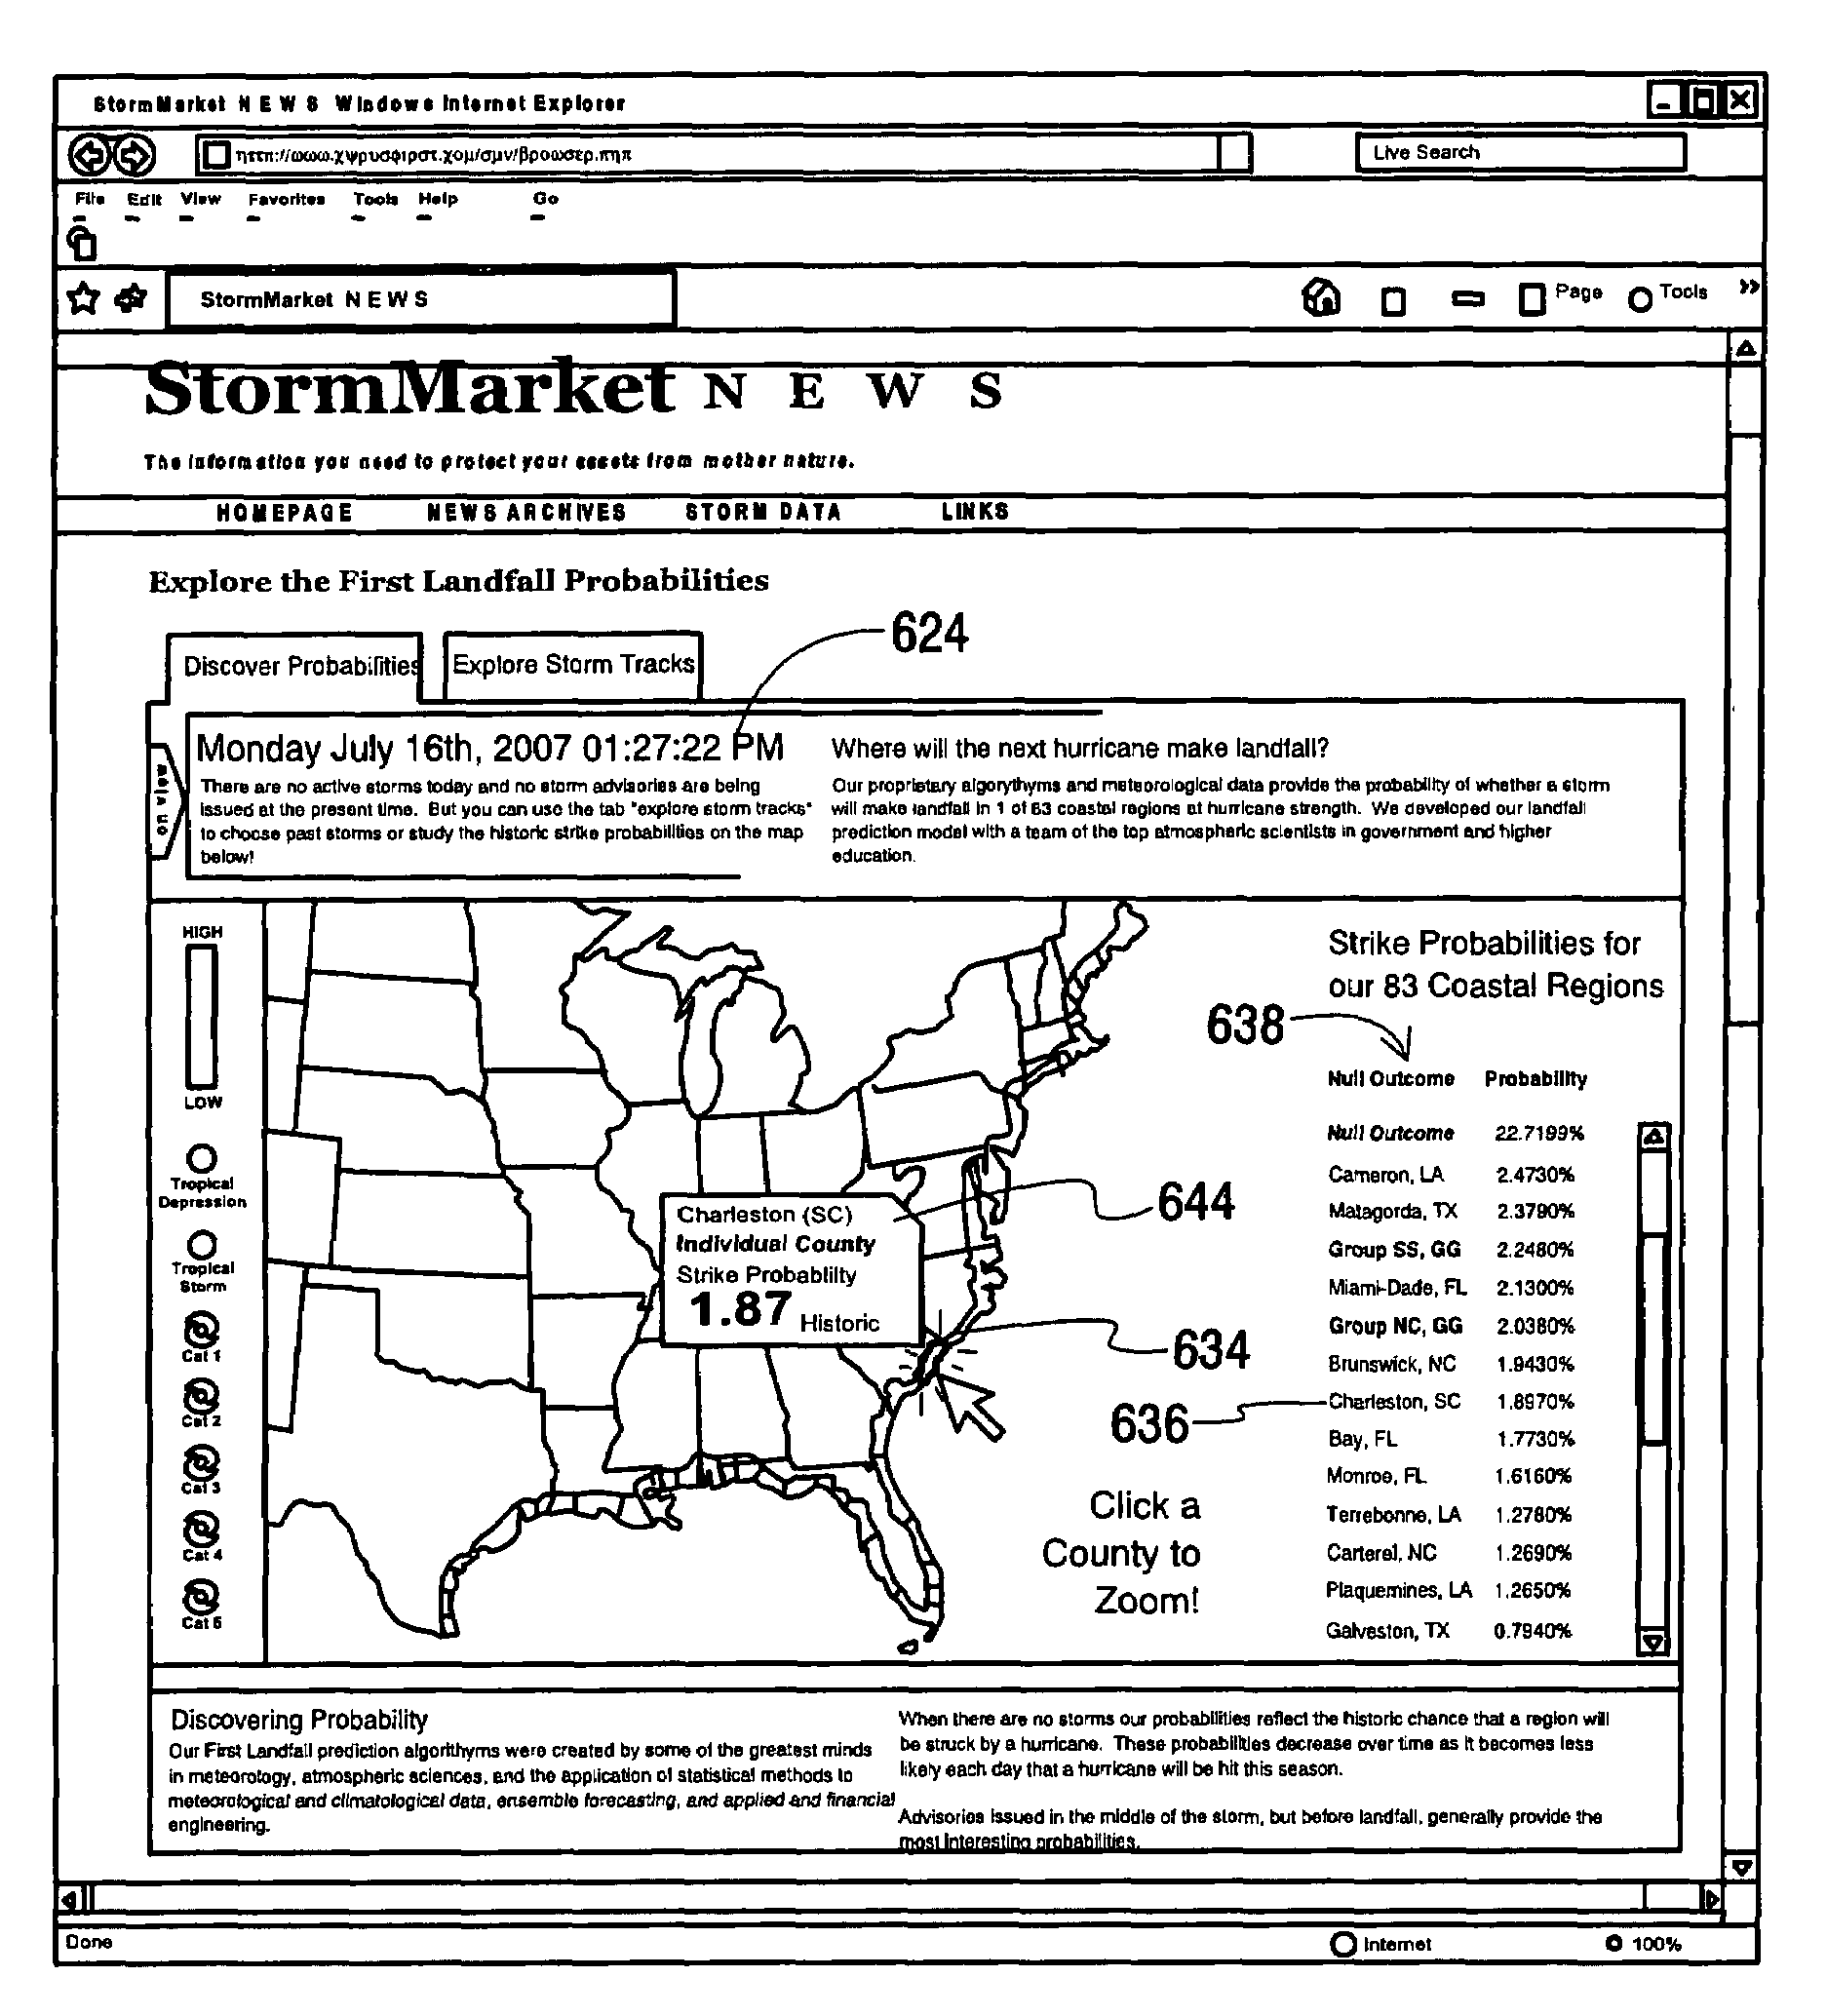
"The invention is about conducting financial activities based on natural peril events, such as tornados or earthquakes, using a graphical user interface. The system allows participants to predict the outcome of the event and invest in a derivative product that changes in value based on the prediction. The system also includes information about the regions where the event is likely to occur and offers first prediction data that changes over time. The technical effect of the invention is to provide a system for conducting financial activities based on natural peril events that allows participants to predict and invest in the future, using a graphical user interface."

Problems solved by technology

Oftentimes, natural peril events contain sufficient energy to impose potentially significant financial burdens arising from damage to property.
It is the nature of such catastrophes that they cannot be predicted with exact certainty, even in severity or number of occurrences within an event season or the exact time and / or duration of an event.
Further, these same policies do not provide any coverage for the outside areas of a home or business such as landscaping, outside lighting, docks, fencing and the like.
Often, property owners do not have sufficient flood insurance or have other omissions or insufficient coverage which result in catastrophic financial losses in even the lowest rated hurricanes.
Great losses suffered by property owners, such as those located along coastal and outlying areas, can be overwhelming for those who cannot afford to be self-insured.
Insurance companies offer substantial aid for these individuals, but economic strains caused by unusually active hurricane seasons have resulted in relatively high premiums.
However, substantial economic burdens remain, such as high deductible amounts and excluded items, which represent damage costs which must be borne directly by the individual.
Further, there are considerable delays in obtaining insurance relief, due to a number of factors outside of the owner's control, such as delays associated with adjuster scheduling, claim processing and governmental determinations.
These delays are considerably extended when wide scale damage occurs.
In addition to increased whether severity, other factors have been cited as causes for unexpectedly large damage estimates.
For example, it has been estimated that, by year 2020, a single Miami storm could cause catastrophic losses of 500 Billion—several times the damage inflicted by Hurricane Katrina.
In addition to primary damage factors such as loss of property, other factors directly result from a natural event.
For example, the Federal Emergency Management Agency (FEMA) has encountered significant difficulty in providing temporary housing for disaster victims.
Loss of dwellings is aggravated by extensive loss of jobs, further slowing economic and personal recovery.
For example, a tsunami occurring in the next few years is anticipated to result in a 60 Billion dollar disaster, imperiling 1 million residents, affecting 600,000 jobs locally and 2.5 million jobs nationwide.
For example, in one instance, losses are estimated to include the closure of the ports of Los Angeles and Long Beach.
A two-month shutdown of the ports would cost $60 billion and affect 600,000 jobs in the state and 2.5 million jobs nationwide.

Method used


Image

  • Financial activity with graphical user interface based on natural peril events
  • Financial activity with graphical user interface based on natural peril events
  • Financial activity with graphical user interface based on natural peril events

Examples


case i

[0189] πt-1k>vt-1k. Here the pricing probability for outcome k is too high relative to the aggregate market opinion from Equation 14. This condition can also be diagnosed from the relationship between the indicative payout and the par value (adjusted for time value of money), since

[0190]πt-1k>vt-1k=πt-1k⁢c⁢⁢exp⁡[r⁢⁢j / 365]Wt-1k,so⁢⁢that⁢⁢Wt-1k>c⁢⁢exp⁡[r⁢⁢j / 365].(20)

That is, options for outcome k are overpriced if the indicative payout is greater than the (interest-adjusted) par value. For this case, increasing the pricing probability for outcome k would produce even greater separation between the pricing and market probabilities, so αtk=0 is used in Equation 19, and pricing probabilities for all of the outcomes are unchanged. Any further purchases in outcome k will reduce the indicative payout Wk through increases in Nk, so that vk will rise toward πk. Subsequent purchases in any outcome other than k will drive πk downward, toward vk.

case ii

[0191] Market equilibrium where πt-1k=vt-1k. Here the market is in equilibrium before the purchase of the next option t for outcome k. This purchase will raise the market probability for this outcome, vtk>vt-1k, so the pricing probability πtk should increase correspondingly. Explicit indication of outcome k using superscripts will be suppressed for notational simplicity). We wish to increase the pricing probability πt, using Equation 19, to match the increase in vt resulting from the payout dilution for this outcome produced by the purchase of one additional option. Therefore,

[0192]πt=πt-1+αt⁢πt-1⁡(1-πt-1)=vt=πt-1⁢c⁢⁢exp⁡(r⁢⁢j / 365)Wt=πt-1⁢c⁢⁢exp⁡(r⁢⁢j / 365)⁢(Nt-1+1)Mt-1+πt-1⁢c⁢⁢exp⁡(r⁢⁢j / 365)=πt-1⁢c⁢⁢exp⁡(r⁢⁢j / 365)⁢(Nt-1+1)Nt-1⁢c⁢⁢exp⁡(r⁢⁢j / 365)+πt-1⁢c⁢⁢exp⁡(r⁢⁢j / 365)=πt-1⁡(Nt-1+1)Nt-1+πt-1.(21)

Here use has been made of the fact that, because of the equilibrium at step t−1, Mt-1=Nt-1 c exp(rj / 365). Solving for the equilibrium adjustment parameter,

[0193]αt=⁢[πt-1⁡(Nt-1+1)Nt-1+πt-1-πt-...

case iii

[0194] πt-1kt-1k. Here the options for outcome k are under priced, and αtk should be chosen to adjust πtk upward. Intuitively, this adjustment should be relatively modest (αtk≈1 / Nt-1k) for πt-1k≈vt-1k, and increase as the discrepancy between πt-1k and vt-1k increases, until a maximum value αmax is chosen corresponding to the maximum discrepancy between πt-1k and vt-1k. This maximum discrepancy occurs for Wt-1k=Fc. However, the specific form that the function for α should take between these two endpoints is not clear. Referring now to FIG. 43. two candidate pricing curves for specifying the parameter α, in the range Fc≦W≦c are shown. FIG. 43 shows two candidate pricing curve functions, the consequences of which are explored through simulation in the next section. A value for αmax must also be chosen. When Nt-1 is small, so that αmax / Nt-1, then αt=1 / Nt-1.

[0195]In one example of financial activity according to principles of the present invention, equation 19 implements an adaptive cont...


PUM


Abstract

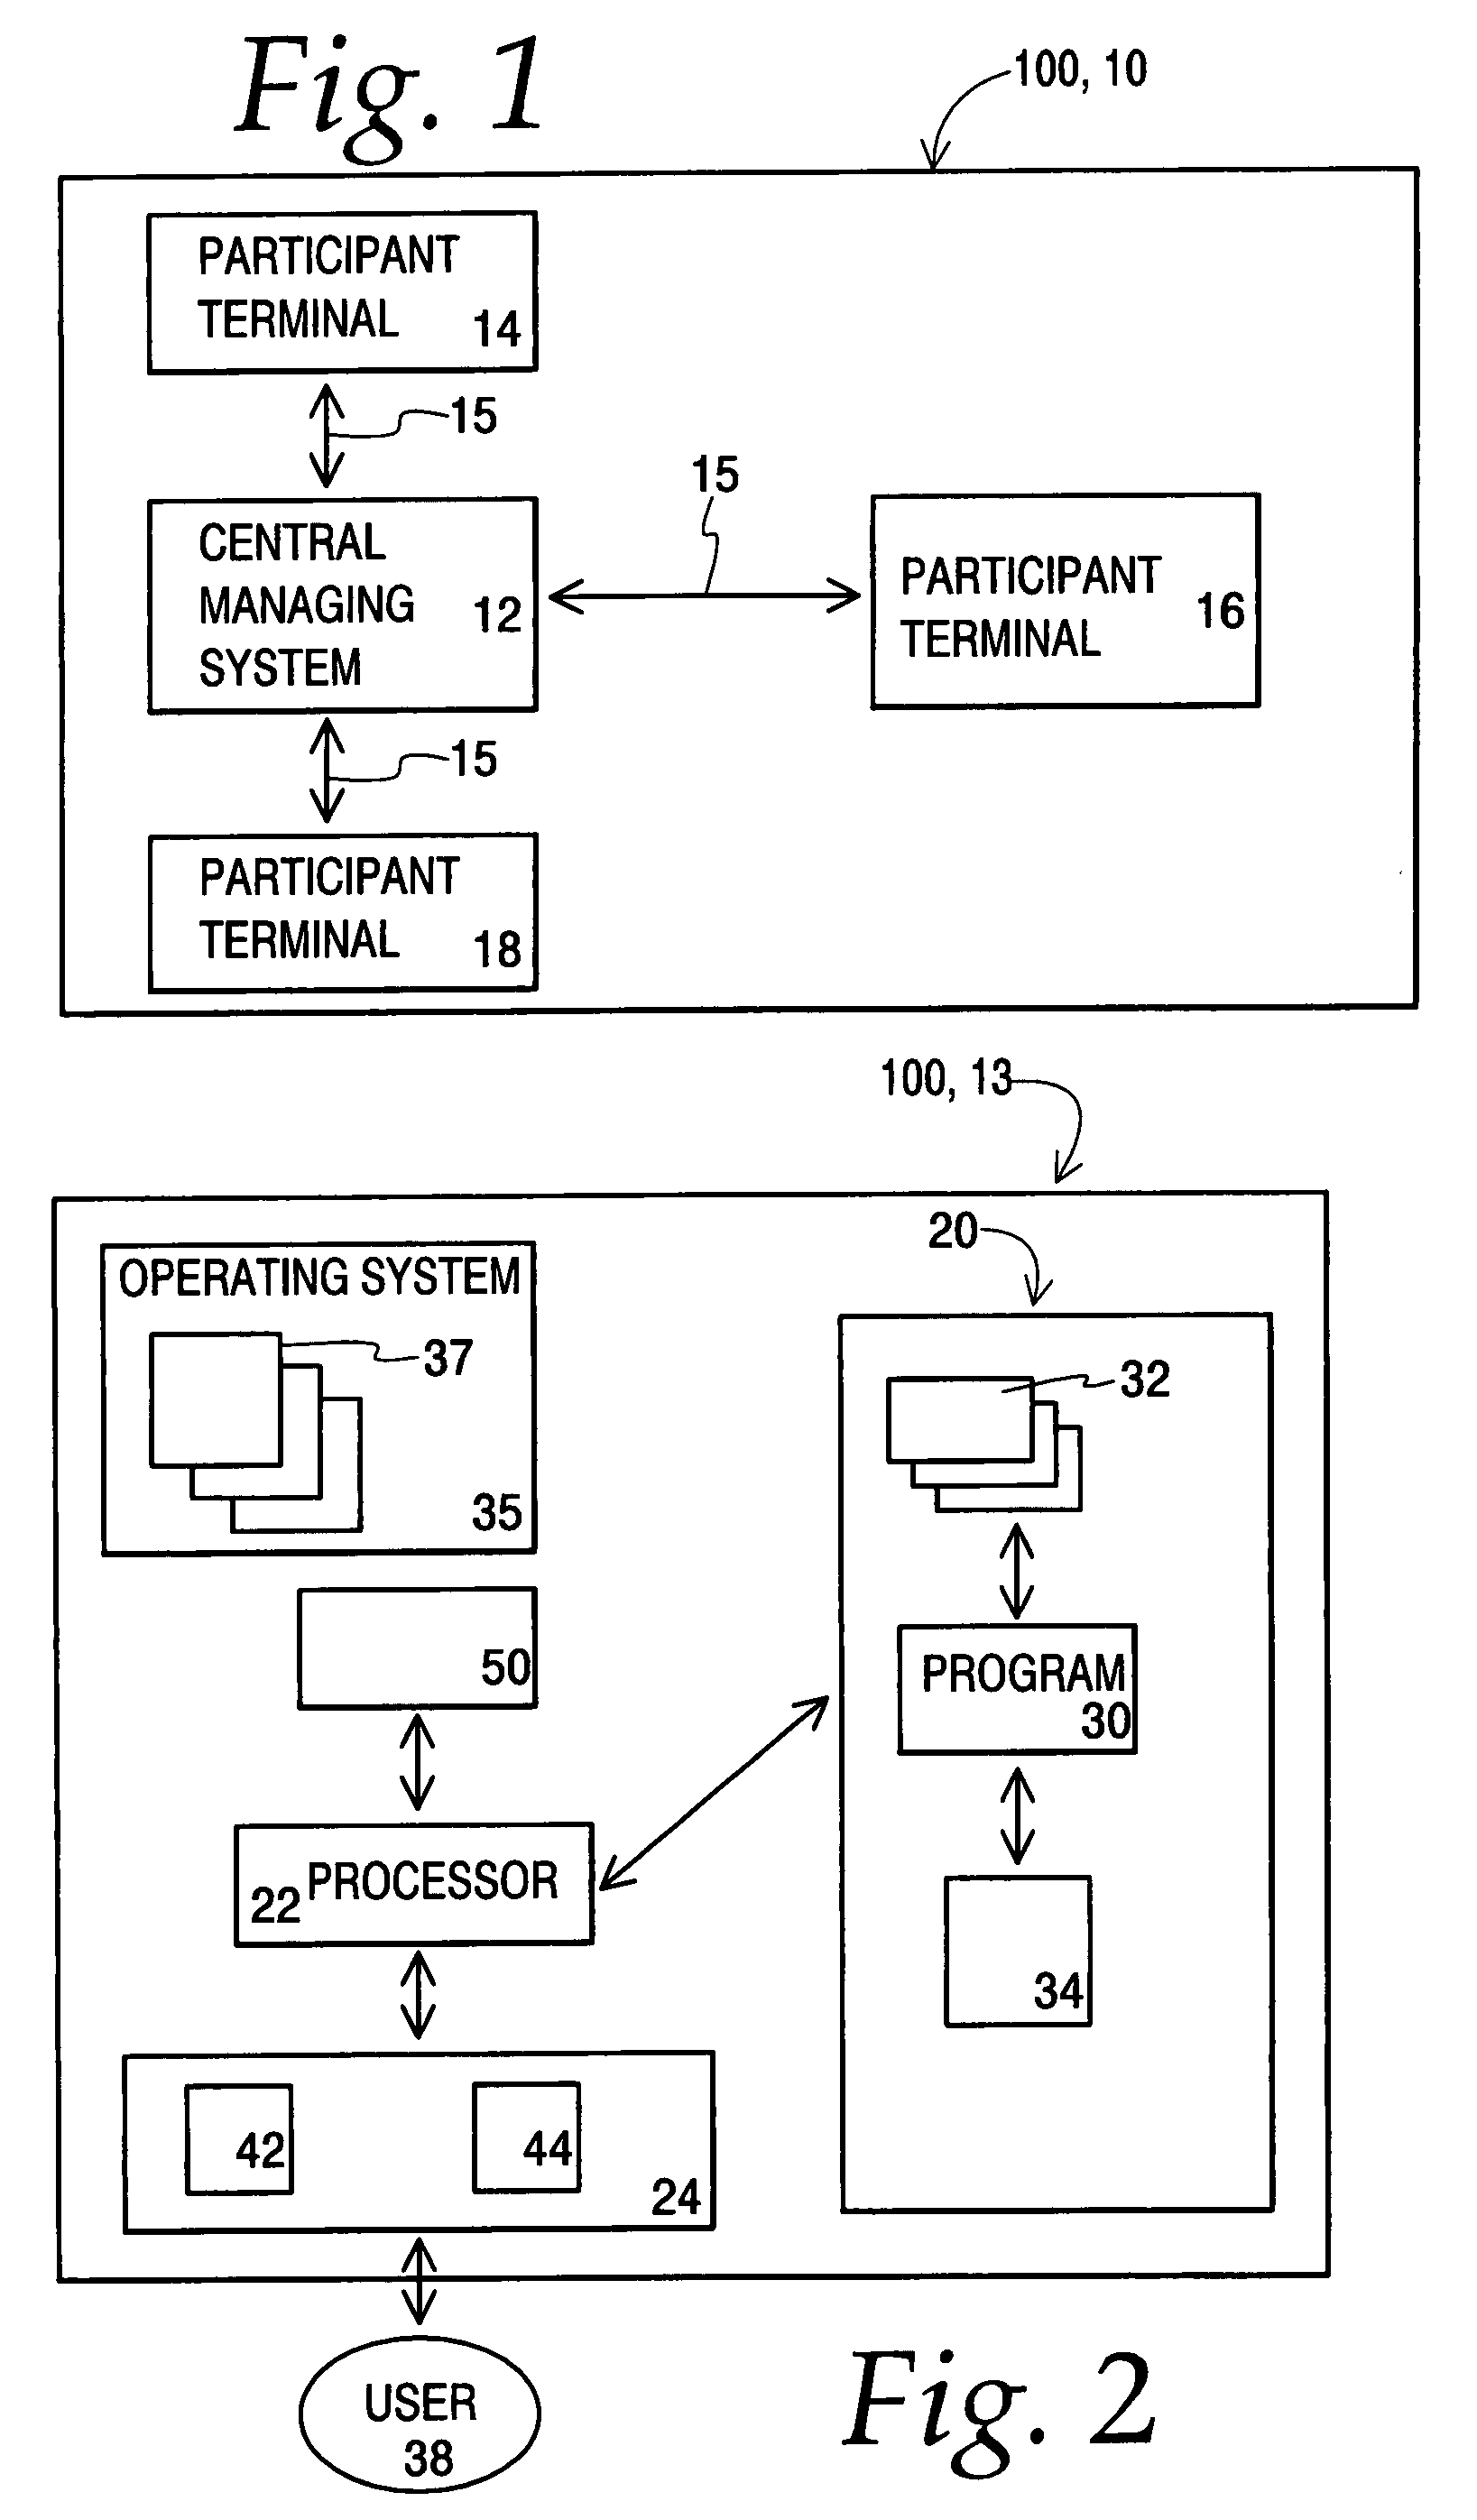
A financial activity network includes a central managing system connected to a plurality of participant terminals. Rules governing operation of the financial activity are stored for future reference. A participant provides investment information such as a map location for the predicted strike by the natural peril event and, optionally, one or more secondary parameters relating to the natural peril event, such as the time interval between the time of investment and the time of an event strike and / or the severity of the event strike according to an established scale. In one example, an external objective independent information source is consulted, with the external objective independent information source providing monitoring, interpretation and derived determination of parameters pertaining to the natural peril event. Methods and articles of manufacture are also disclosed.

Description

CROSS-REFERENCE TO RELATED APPLICATION[0001]This is a continuation-in-part of U.S. non-provisional patent application Ser. No. 11 / 312,662, filed Dec. 20, 2005 now U.S. Pat. No. 7,693,766 which claims the benefit of U.S. Provisional Patent Application No. 60 / 637,784, filed Dec. 21, 2004 and a continuation-in-part of U.S. non-provisional patent application Ser. No. 11 / 901,050, filed Sep. 14, 2007 now U.S. Pat. No. 7,584,134 which is a continuation-in-part of U.S. non-provisional patent application Ser. No. 11 / 312,783, filed Dec. 20, 2005 now U.S. Pat. No. 7,584,133 which claims the benefit of U.S. Provisional Patent Application No. 60 / 637,784, filed Dec. 21, 2004 which are incorporated by reference herein in their entirety.BACKGROUND OF THE INVENTION[0002]1. Field of the Invention[0003]The present invention pertains to financial activities and in particular to such activities in which a financial return may be paid out based on a participant's prediction of weather-related or other na...

Claims


Application Information

Patent Timeline
Patent Type & Authority Patents(United States)
IPC IPC(8): G06Q40/00
CPCG06Q40/00G06Q40/06G06Q50/34G07F17/3255
Inventor HOROWITZ, KENNETH A.
Owner WEATHER RISK SOLUTIONS
Learn More