
Travel congestion probability estimation method

A technology of probability and probability density function, which is applied in computing, special data processing applications, instruments, etc., can solve problems such as small proportion of severe road network congestion, incomparable evaluation results, and large fluctuations in evaluation results

Active Publication Date: 2015-01-07
北京交通发展研究院
View PDF5 Cites 12 Cited by
  • Summary
  • Abstract
  • Description
  • Claims
  • Application Information

AI Technical Summary

Problems solved by technology

The former calculation will smooth out the severe congestion, which cannot reflect the prominent impact of severe congestion on traffic operation evaluation. In the application, the longer the road section is, the less sensitive it is to congestion. Length road evaluation results are not comparable
The reason is that the most important contribution to travel experience is the severe congestion part, that is, the rightmost part of the congestion distribution. The probability distribution of the degree of vehicle congestion is diverse, and the mean value cannot reflect the change in the proportion of the rightmost end of the distribution.
The latter has the same problem. The longer the length of the road section, the smaller the probability of being judged as severe congestion, and the smaller the proportion of serious congestion in the road network.
At the same time, because the latter judges congestion based on the average speed of road sections, when the number of road sections is small, the evaluation results fluctuate greatly, which limits its application to road and small area evaluation.
If two methods are used to evaluate the whole road network and small areas, it will bring difficulties in subsequent comparative analysis

Method used


Image

  • Travel congestion probability estimation method
  • Travel congestion probability estimation method
  • Travel congestion probability estimation method

Examples


Embodiment Construction

[0032] The present invention will be described in further detail below in conjunction with the accompanying drawings and specific embodiments, but not as a limitation of the present invention.

[0033] figure 1 Schematic flow chart provided for the method embodiment of the present invention. refer to figure 1 , a method for estimating the probability of travel congestion, including the following steps:

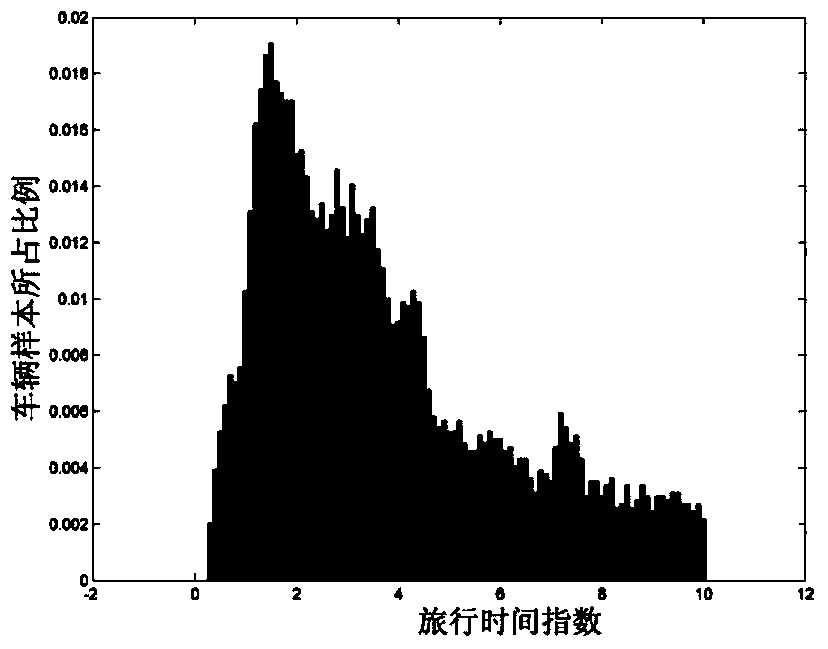
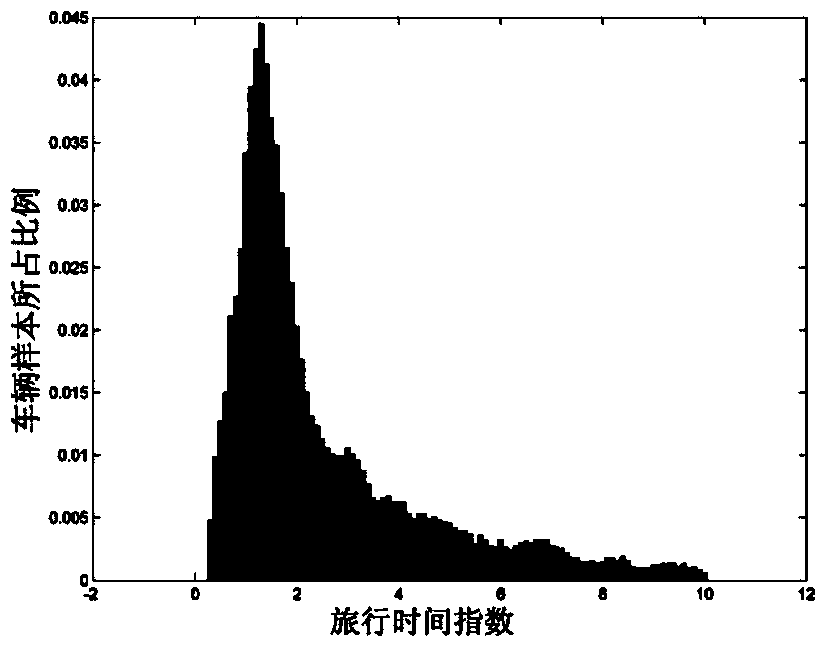
[0034] According to the obtained traffic data, the probability distribution of the travel time index of the vehicle sample in each road section in the target road network is calculated under different average speeds of the road section. The travel time index is the ratio of the free flow speed of the road section to the actual speed of the vehicle sample;

[0035] Model the travel time index z distribution of vehicle samples in each road segment as a lognormal distribution z~ln(μ,σ 2 ), according to the statistical results of the parameters μ and σ of the lognormal distribu...


PUM


Abstract

The invention discloses a travel congestion probability estimation method which includes the following steps of: counting the probability distribution of vehicle travel time indexes of each road section in the same target road network at different uniform velocity conditions; obtaining the probability distribution parameters mu m and sigma 2 at different uniform velocity conditions through maximum likelihood estimation; determining the speed variable coefficient of travel time index probability distribution in all road sections through least-squares approximation; calculating the corresponding probability distribution parameters mu m and sigma 2 according to the uniform velocity at each road section at given time so as to obtain the probability density of the vehicle travel time indexes at all road sections, then weighting the probability density of the vehicle travel time indexes at all road sections with the number of vehicles at road sections as the weight to obtain a probability density function p (z) of the vehicle travel time indexes in the road network, and obtaining the probability of three congestion conditions of the target road network according to a cumulative probability distribution function P (z) corresponding to the p (z). The travel congestion probability estimation method can escape from the influence of the road section lengths on the estimation result.

Description

technical field [0001] The invention relates to the technical field of traffic condition evaluation technology, in particular to a method for estimating the probability of travel congestion. Background technique [0002] With the simultaneous and rapid development of urbanization, modernization and motorization in China, as well as the rapid growth of urban population and the rapid growth of motor vehicle ownership, traffic congestion has become increasingly serious. Timely and accurate understanding of traffic operation conditions is the basis for formulating relevant policies, and understanding and quantitative measurement of traffic operation conditions are the prerequisites for planning, management and other transportation work. Predicting traffic conditions can guide people to arrange travel plans and travel routes. With the refinement of transportation work, the demand for traffic system operation evaluation has expanded from the overall road network to multi-level re...

Claims


Application Information

Patent Timeline
Patent Type & Authority Applications(China)
IPC IPC(8): G06F19/00
Inventor 张彭郭继孚
Owner 北京交通发展研究院
Learn More