
Industrial process fault diagnosis method based on KPCA

A fault diagnosis and industrial process technology, applied in the direction of instruments, electrical testing/monitoring, control/regulation systems, etc., can solve the problem of inability to effectively distinguish fault information from normal information, excessive reconstruction, and inability to reflect the nonlinear characteristics of data, etc. question

Active Publication Date: 2015-09-16
SHEN ZHEN FENGJING NETWORKS TECH CO LTD
View PDF5 Cites 9 Cited by
  • Summary
  • Abstract
  • Description
  • Claims
  • Application Information

AI Technical Summary

Problems solved by technology

However, the traditional fault reconstruction method is a linear modeling method, which cannot reflect the nonlinear characteristics of the data; and this method only focuses on the internal relationship of the fault data, and cannot effectively distinguish the fault information from the normal information in the data. Fault reconstruction based on the fault feature direction extracted by the method will lead to excessive reconstruction

Method used

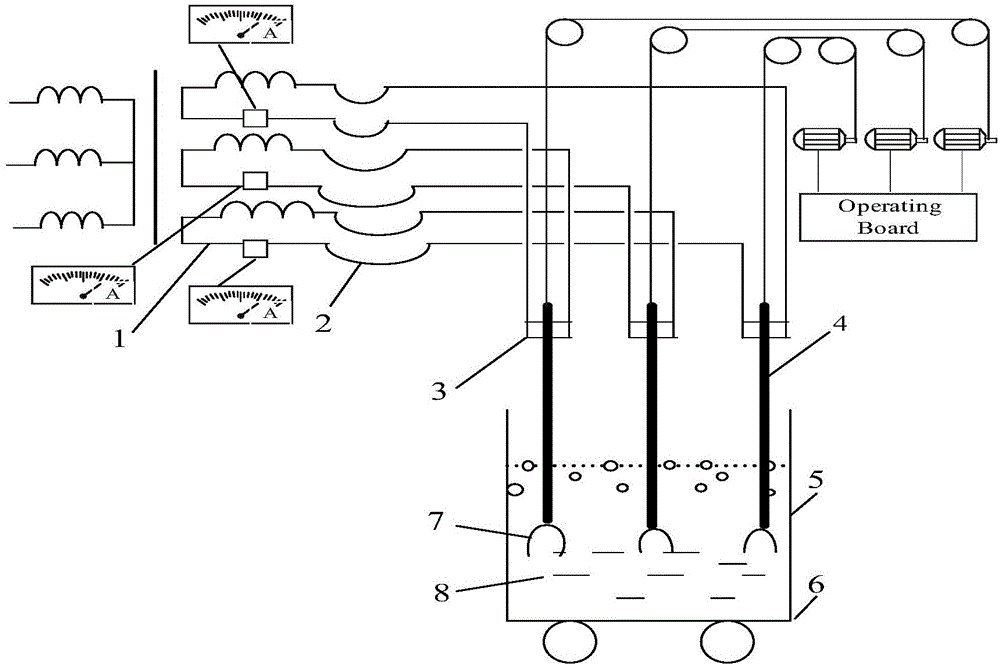

Image

  • Industrial process fault diagnosis method based on KPCA
  • Industrial process fault diagnosis method based on KPCA
  • Industrial process fault diagnosis method based on KPCA

Examples


Embodiment 1

[0215] Real-time collection of 400 new data 1 of the smelting process of the fused magnesium furnace, the T of the new data 1 2 Statistics detection picture with SPE statistics detection picture Such as Image 6 As shown, among them, Image 6 (a) T for the new data 2 Statistics detection picture , Image 6 (b) SPE statistics detection for new data picture ,from picture As can be seen in , the T of the new data 1 2 Both statistics and SPE statistics began to exceed the limit at about the 101st sampling point, and formed a stable alarm, indicating that a fault occurred.

[0216] For new data 1, use the historical fault data of type l for T 2 According to the fault characteristic direction reconstructed by statistics, the fault direction is reconstructed for the new data, and the fault direction is reconstructed for the new data according to the fault characteristic direction reconstructed by the SPE statistics by using the historical fault data of the first type.

[...

Embodiment 2

[0221] Real-time collection of 400 new data 2 of the smelting process of the fused magnesium furnace, the T of the new data 2 2 Statistics detection picture with SPE statistics detection picture Such as Figure 9 As shown, among them, Figure 9 (a) T for the new data 2 Statistics detection picture , Figure 9 (b) SPE statistics detection for new data picture ,from picture As can be seen in , the T of the new data 2 2 Both statistics and SPE statistics began to exceed the limit around the 150th sample, and formed a stable alarm, indicating that a fault occurred.

[0222] For the new data 2, use the l-type historical fault data for T 2 According to the fault characteristic direction reconstructed by statistics, the fault direction is reconstructed for the new data, and the fault direction is reconstructed for the new data according to the fault characteristic direction reconstructed by the SPE statistics by using the historical fault data of the first type.

[0223] ...


PUM


Abstract

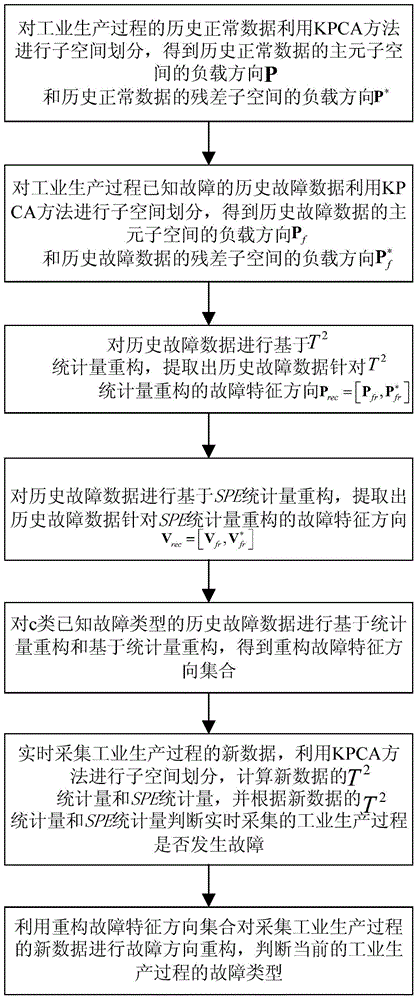
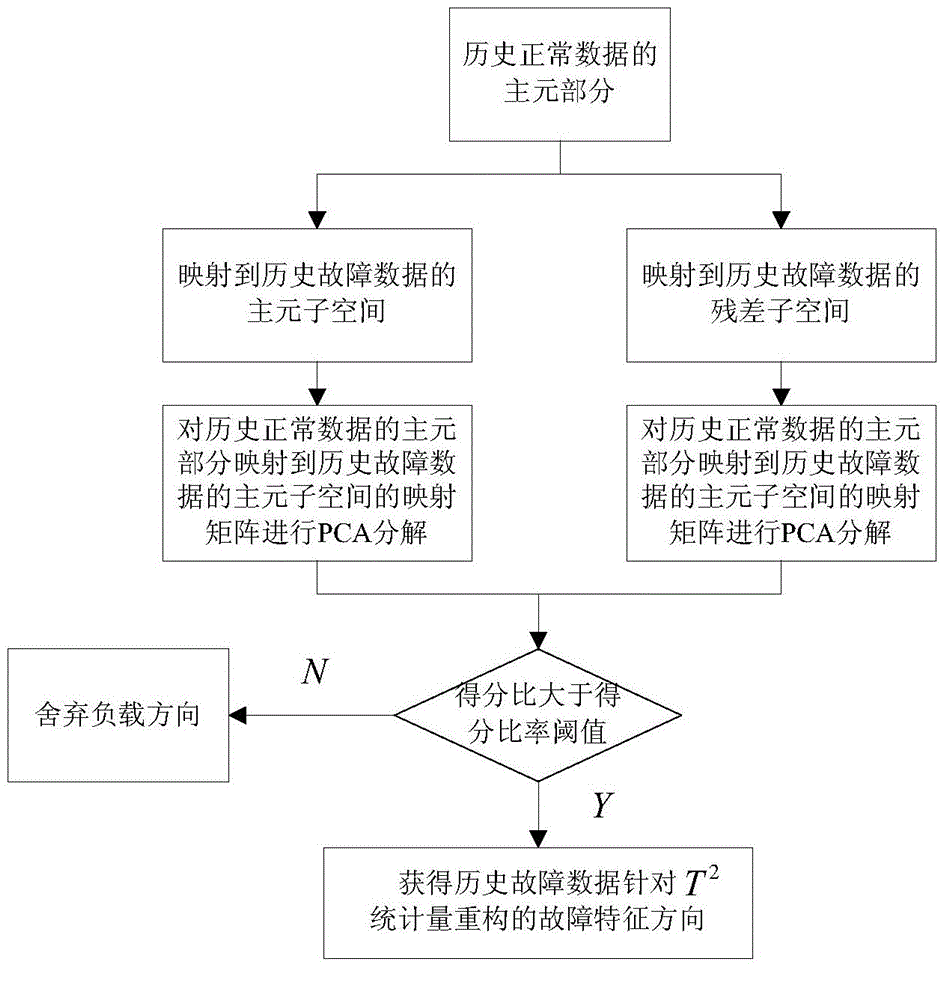
The invention discloses an industrial process fault diagnosis method based on KPCA. The industrial process fault diagnosis method based on KPCA comprises steps of extracting a principal element sub space load direction and a residual sub space load direction through the KPCA method from historically-normal data during the industrial production procedure, extracting the principal element sub space load direction and the residual sub space load direction through the KPCA method from historically-faulted data with known faults, performing T2-based statistical magnitude reconstruction and SPE-based statistical magnitude reconstruction on the historically-faulted data, the fault type of which is known, extracting the fault characteristic direction of the historically-faulted data which is reconstructed specific to the T2 statistical magnitude and extracting the fault characteristic direction of the historically-faulted data which is reconstructed specific to the SPE statistical magnitude, obtaining the collection of the reconstruction fault characteristic direction, collecting industrial production procedure new data in real time, utilizing the KPCA method to calculate the T2 statistical magnitude and the SPE statistical magnitude by, determining whether faults happen during the industrial production procedure, utilizing the reconstruction characteristic direction collection to perform fault direction reconstruction on new data, and determining the fault type of the current industrial production procedure.

Description

technical field [0001] The invention belongs to the field of process control, and in particular relates to a KPCA-based industrial process fault diagnosis method. Background technique [0002] Using the data obtained in the industrial production process to model and detect and diagnose the faults in the production process is a very challenging problem, which has received extensive attention in recent years. Many scholars have studied the detection and diagnosis of faults in the production process by using multivariate statistical methods such as PCA and PLS. These methods are able to extract the latent characteristics of the measurement data, and use statistical principles to define detection statistics and their control limits under normal production conditions based on these characteristics. During on-line monitoring, the corresponding statistics are calculated through the new sampling data, and if the result exceeds the limit and an alarm is issued, it is considered that...

Claims


Application Information

Patent Timeline
IPC IPC(8): G05B23/02
CPCG05B23/0235
Inventor 张颖伟杜文友严启保王正兵
Owner SHEN ZHEN FENGJING NETWORKS TECH CO LTD
Learn More