Method and device for drawing 3D column chart

A histogram, 3D technology, applied in the direction of image data processing, instruments, etc., can solve the problems of lack of three-dimensional, unable to achieve rotation, graphics movement and fixation, etc., to achieve the effect of three-dimensional and realistic graphics, easy to use

Inactive Publication Date: 2016-01-27
SUZHOU INDAL PARK LINKAGE SOFTWARE
View PDF5 Cites 7 Cited by
  • Summary
  • Abstract
  • Description
  • Claims
  • Application Information

AI Technical Summary

Problems solved by technology

[0003] At present, the drawing and browsing of histograms are mostly concentrated in two-dimensional space, and lack of three-dimensional stereo, so that users cannot intuitively understand the connotation expressed by the graph, and the movement of the graph is relatively fixed, and functions such as rotation cannot be realized

Method used


Image

  • Method and device for drawing 3D column chart
  • Method and device for drawing 3D column chart

Examples


Embodiment Construction

[0030] In order to make the objectives, technical solutions and advantages of the present invention clearer, the embodiments of the present invention will be further described in detail below with reference to the accompanying drawings.

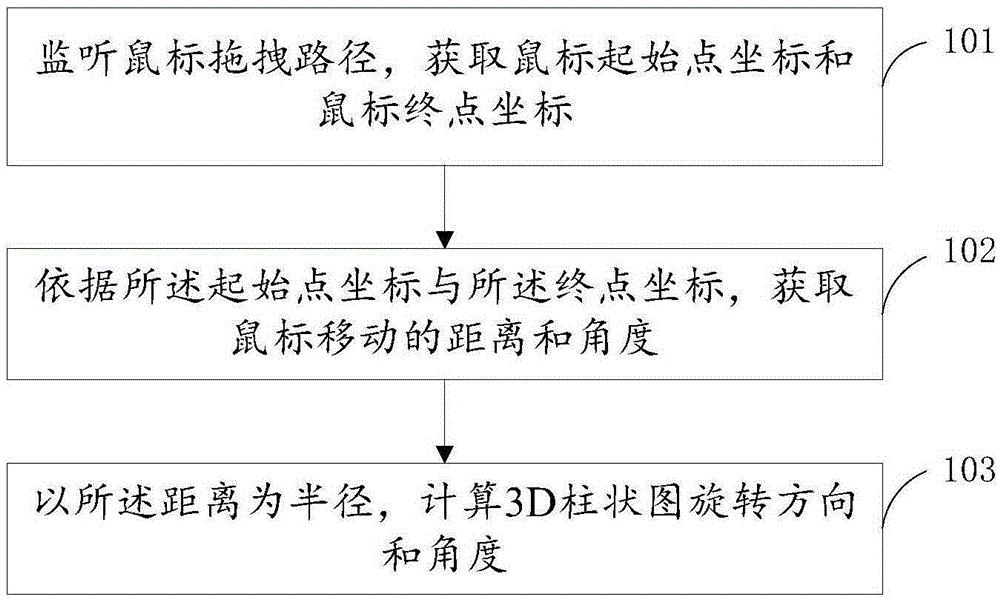
[0031] figure 1 It is a flowchart of a method for drawing a 3D histogram provided by an embodiment of the present invention. see figure 1 , the method includes:

[0032] 101. Monitor the dragging path of the mouse, and obtain the coordinates of the mouse start point and the mouse end point;

[0033] 102. Obtain the distance and angle of mouse movement according to the coordinates of the starting point and the coordinates of the end point;

[0034] 103. Using the distance as a radius, calculate the rotation direction and angle of the 3D histogram.

[0035] Wherein, the monitoring of the mouse dragging path and obtaining the coordinates of the mouse start point and the mouse end point specifically include:

[0036] When monitoring the mous...


PUM


Abstract

The invention discloses a method and a device for drawing a 3D column chart. The method comprises: monitoring a dragging path of a mouse, and obtaining coordinates of a start point and an end point of the mouse; according to the coordinates of the start point and the end point, obtaining the distance and angle of movement of the mouse; and with the distance as a radius, calculating the rotation direction and angle of a 3D column chart. Through dragging movement of the mouse, when the angle of a figure should change, a figure region is cleared, and the figure is re-drawn to achieve animation effects. A user can get rid of a conventional 2D browsing mode. Not only is the figure stereoscopic and vivid, but the usage is convenient as well. The user only needs to operate the mouse and then can observe the figure from any perspective.

Description

technical field [0001] The present invention relates to the technical field of graphics processing, and in particular, to a method and device for drawing a 3D histogram. Background technique [0002] Histogram, also known as bar graph (English: bargraph), bar graph (English: barchart), bar graph, is a statistical report graph that expresses graphs with the length of a rectangle as a variable. The unequal vertical stripes represent the distribution of the data and are used to compare two or more values ​​(at different times or under different conditions) with only one variable, usually used for analysis of smaller data sets. Histograms can also be arranged horizontally, or expressed in a multi-dimensional manner. [0003] At present, the drawing and browsing of histograms are mostly concentrated in two-dimensional space, lacking three-dimensional three-dimensional space, so that users cannot intuitively understand the connotation expressed by the graphics, and the movement o...

Claims


Application Information

Patent Timeline
Patent Type & Authority Applications(China)
IPC IPC(8): G06T19/00
Inventor 张宝泉
Owner SUZHOU INDAL PARK LINKAGE SOFTWARE
Why Eureka
Try Eureka