Service graph highlights missing nodes and links
A technology of service graphs and links, applied in the field of service graphs, can solve the problems of inactivity or shutdown of microservice links
- Summary
- Abstract
- Description
- Claims
- Application Information
AI Technical Summary
Problems solved by technology
Method used
Image

Examples
Embodiment Construction
[0025] In order to read the following description of the various embodiments, the following sections of the specification and their respective descriptions are useful:
[0026] Section A describes network environments and computing environments that can be used to implement the embodiments described herein;
[0027] Part B describes embodiments of systems and methods for delivering a computing environment to remote users;
[0028] Section C describes embodiments of systems and methods for virtualizing an application delivery controller;
[0029] Part D describes embodiments of systems and methods for providing a clustered device architecture environment; and
[0030] Part E describes an embodiment of a service graph-based platform and technology; and
[0031] Section F describes embodiments of systems and methods for replaying a service graph of multiple microservices.
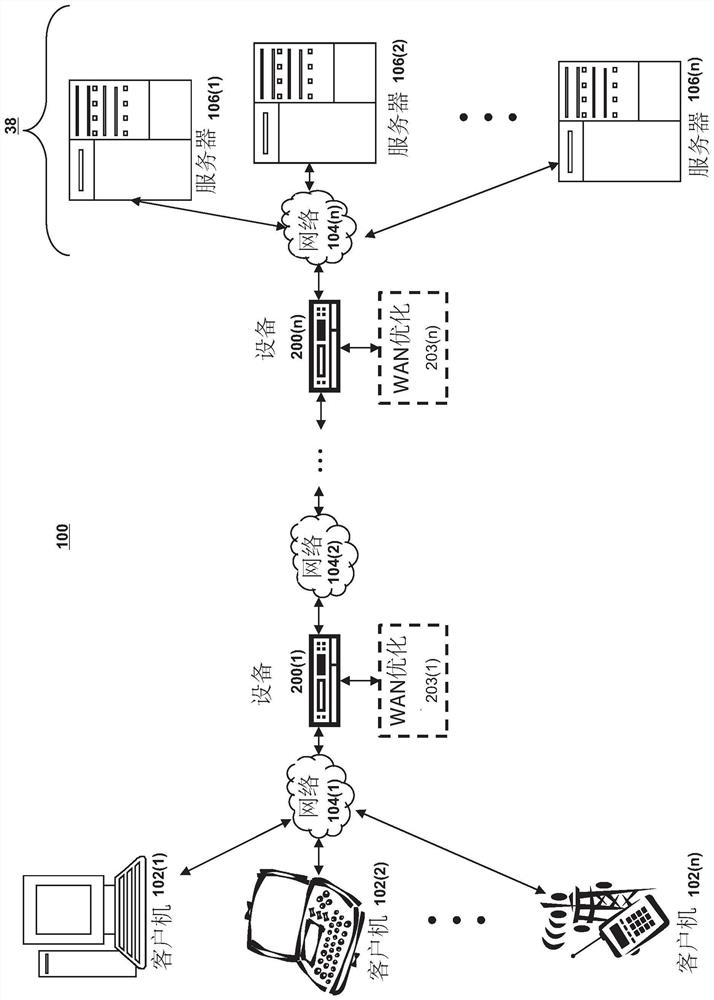
[0032] a. Network and Computing Environment
[0033] refer to Figure 1A , depicts an exemplary netw...
PUM
 Abstract
Description
Claims
Application Information
 - Generate Ideas
- Intellectual Property
- Life Sciences
- Materials
- Tech Scout
- Unparalleled Data Quality
- Higher Quality Content
- 60% Fewer Hallucinations
Browse by: Latest US Patents, China's latest patents, Technical Efficacy Thesaurus, Application Domain, Technology Topic, Popular Technical Reports.
© 2025 PatSnap. All rights reserved.Legal|Privacy policy|Modern Slavery Act Transparency Statement|Sitemap|About US| Contact US: help@patsnap.com