Method of presenting predictive data including standard deviation of financial securities

a financial securities and standard deviation technology, applied in the field of financial instruments trading, can solve the problems of stock market severe economic downturn, loss of a large share of value, requiring years and sometimes decades to recover, and value stocks performing poorly

Inactive Publication Date: 2009-09-10
CONNORS RES +1
View PDF1 Cites 17 Cited by
  • Summary
  • Abstract
  • Description
  • Claims
  • Application Information

AI Technical Summary

Benefits of technology

[0024]The user may also select from a watchlist selector in a risk profile selector button located within the slider such as along a bottom portion thereof. Upon selection of the risk profile selector button, a risk display window may appear as a pop-up window within the main window containing the historical data. The risk display window may graphically display the risk profile for a particular security such as a stock. The risk display window may include a textual and/or graphical illustration (e.g., as a bar chart) of at least one of first, second, and third standard deviations in the stock price. In this regard, the standard deviation data may be presented separately from the historical data and predictive data.
[0025]In a further aspect of the

Problems solved by technology

One drawback associated with the buy-and-hold approach is that the holder of the stock must exercise a tremendous amount of patience and discipline over many years and sometimes through bear markets.
A further drawback associated with the buy-and-hold approach is that the stock market may suffer a severe economic downturn losing a large share of its value and requiring years and sometimes decades to recover.
Some of the reasons supporting the belief that such value stocks are performing poorly include bad press and poor earnings.
However, the ability for day traders to profit is considered by some to be more difficult due to certain changes in the trading environment.
Furthermore, short-term traders or day traders must typically execute a large number of transactions as compared to investors using the buy-and-hold appr

Method used


Image

  • Method of presenting predictive data including standard deviation of financial securities
  • Method of presenting predictive data including standard deviation of financial securities
  • Method of presenting predictive data including standard deviation of financial securities

Examples


Embodiment Construction

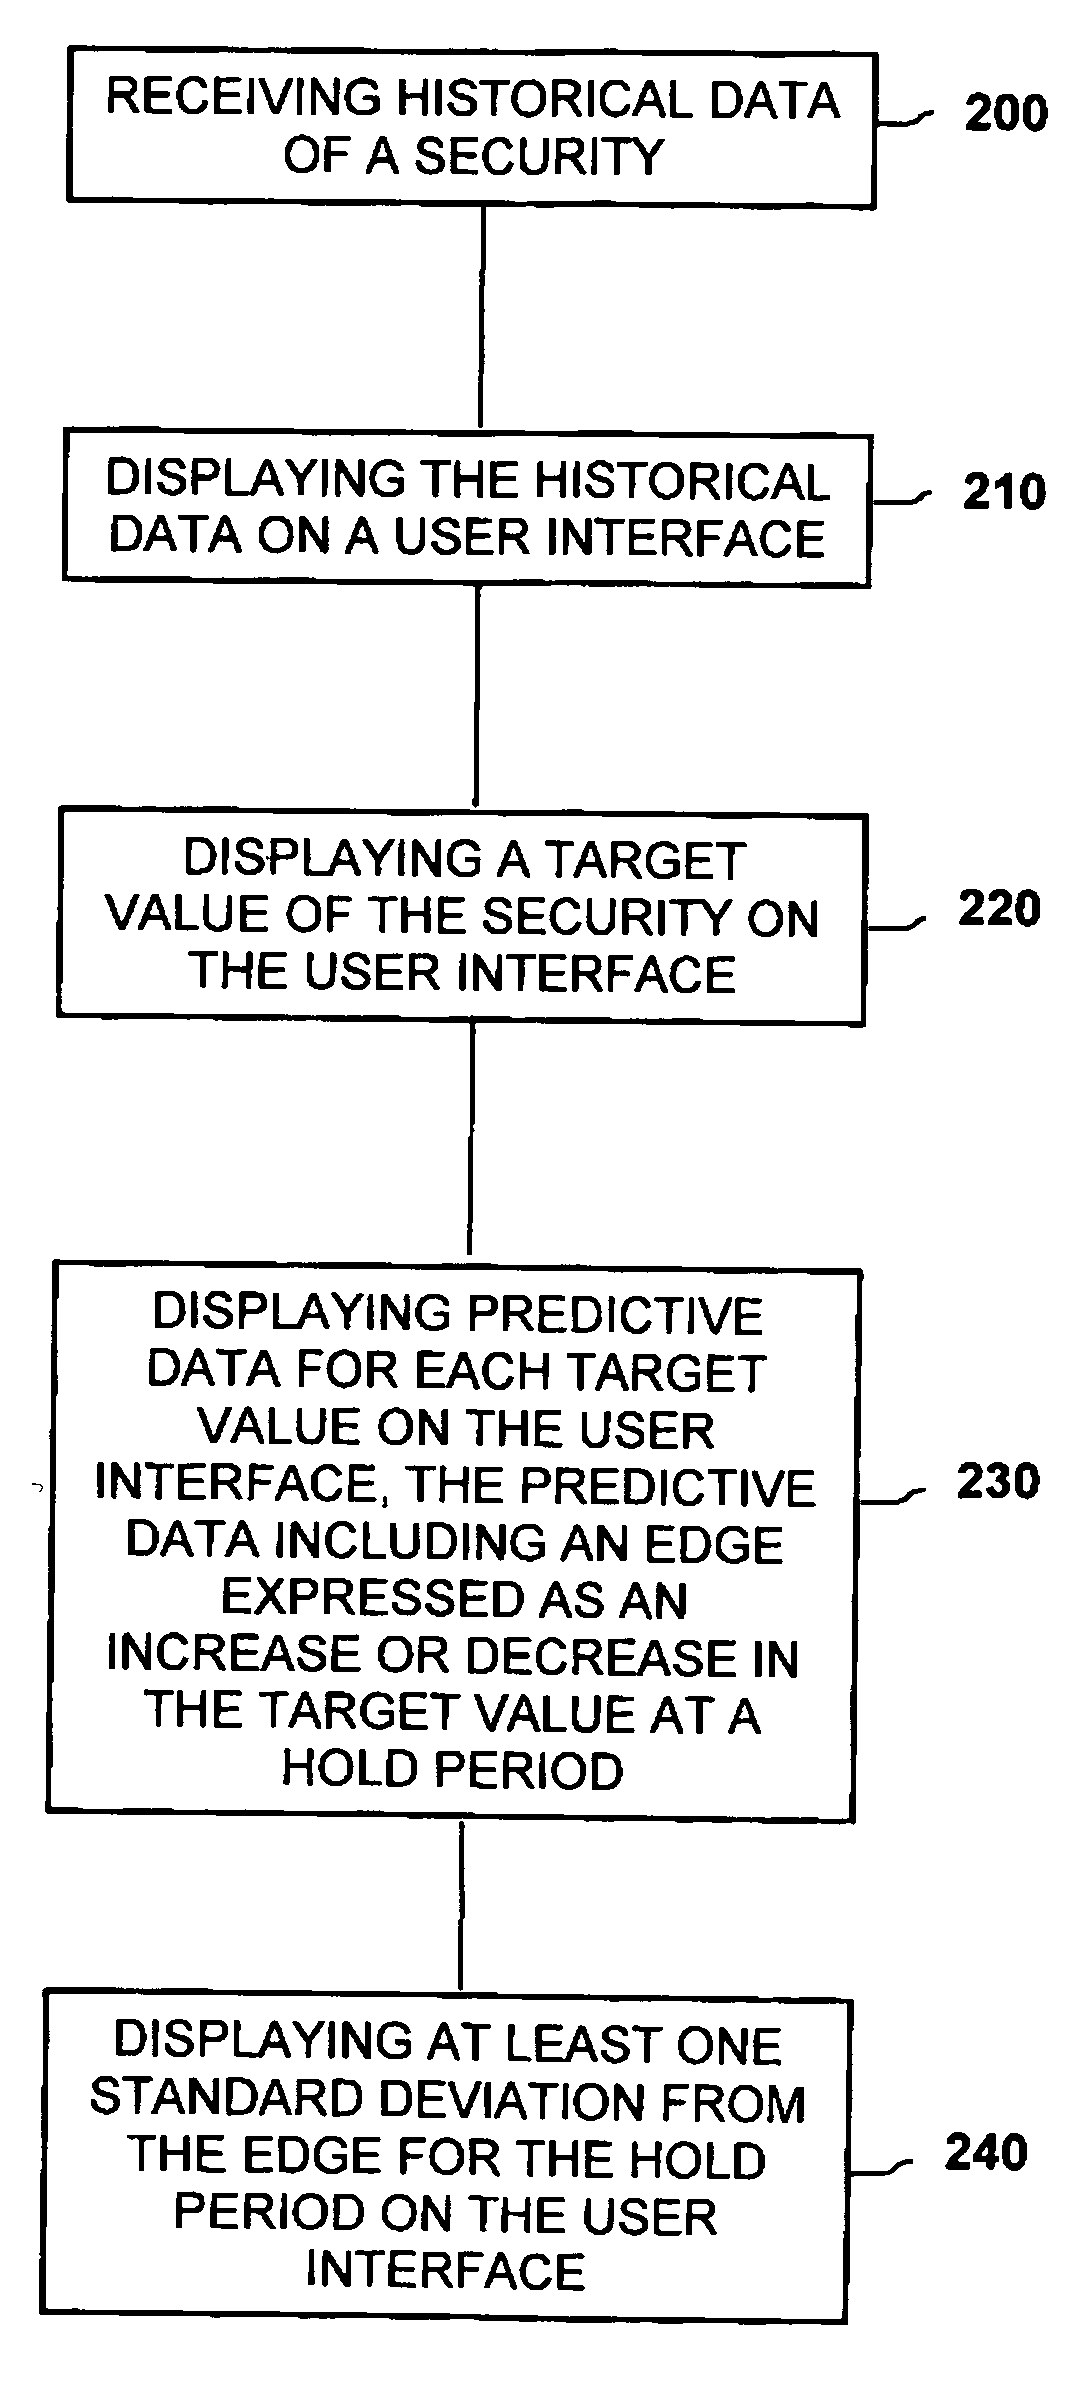
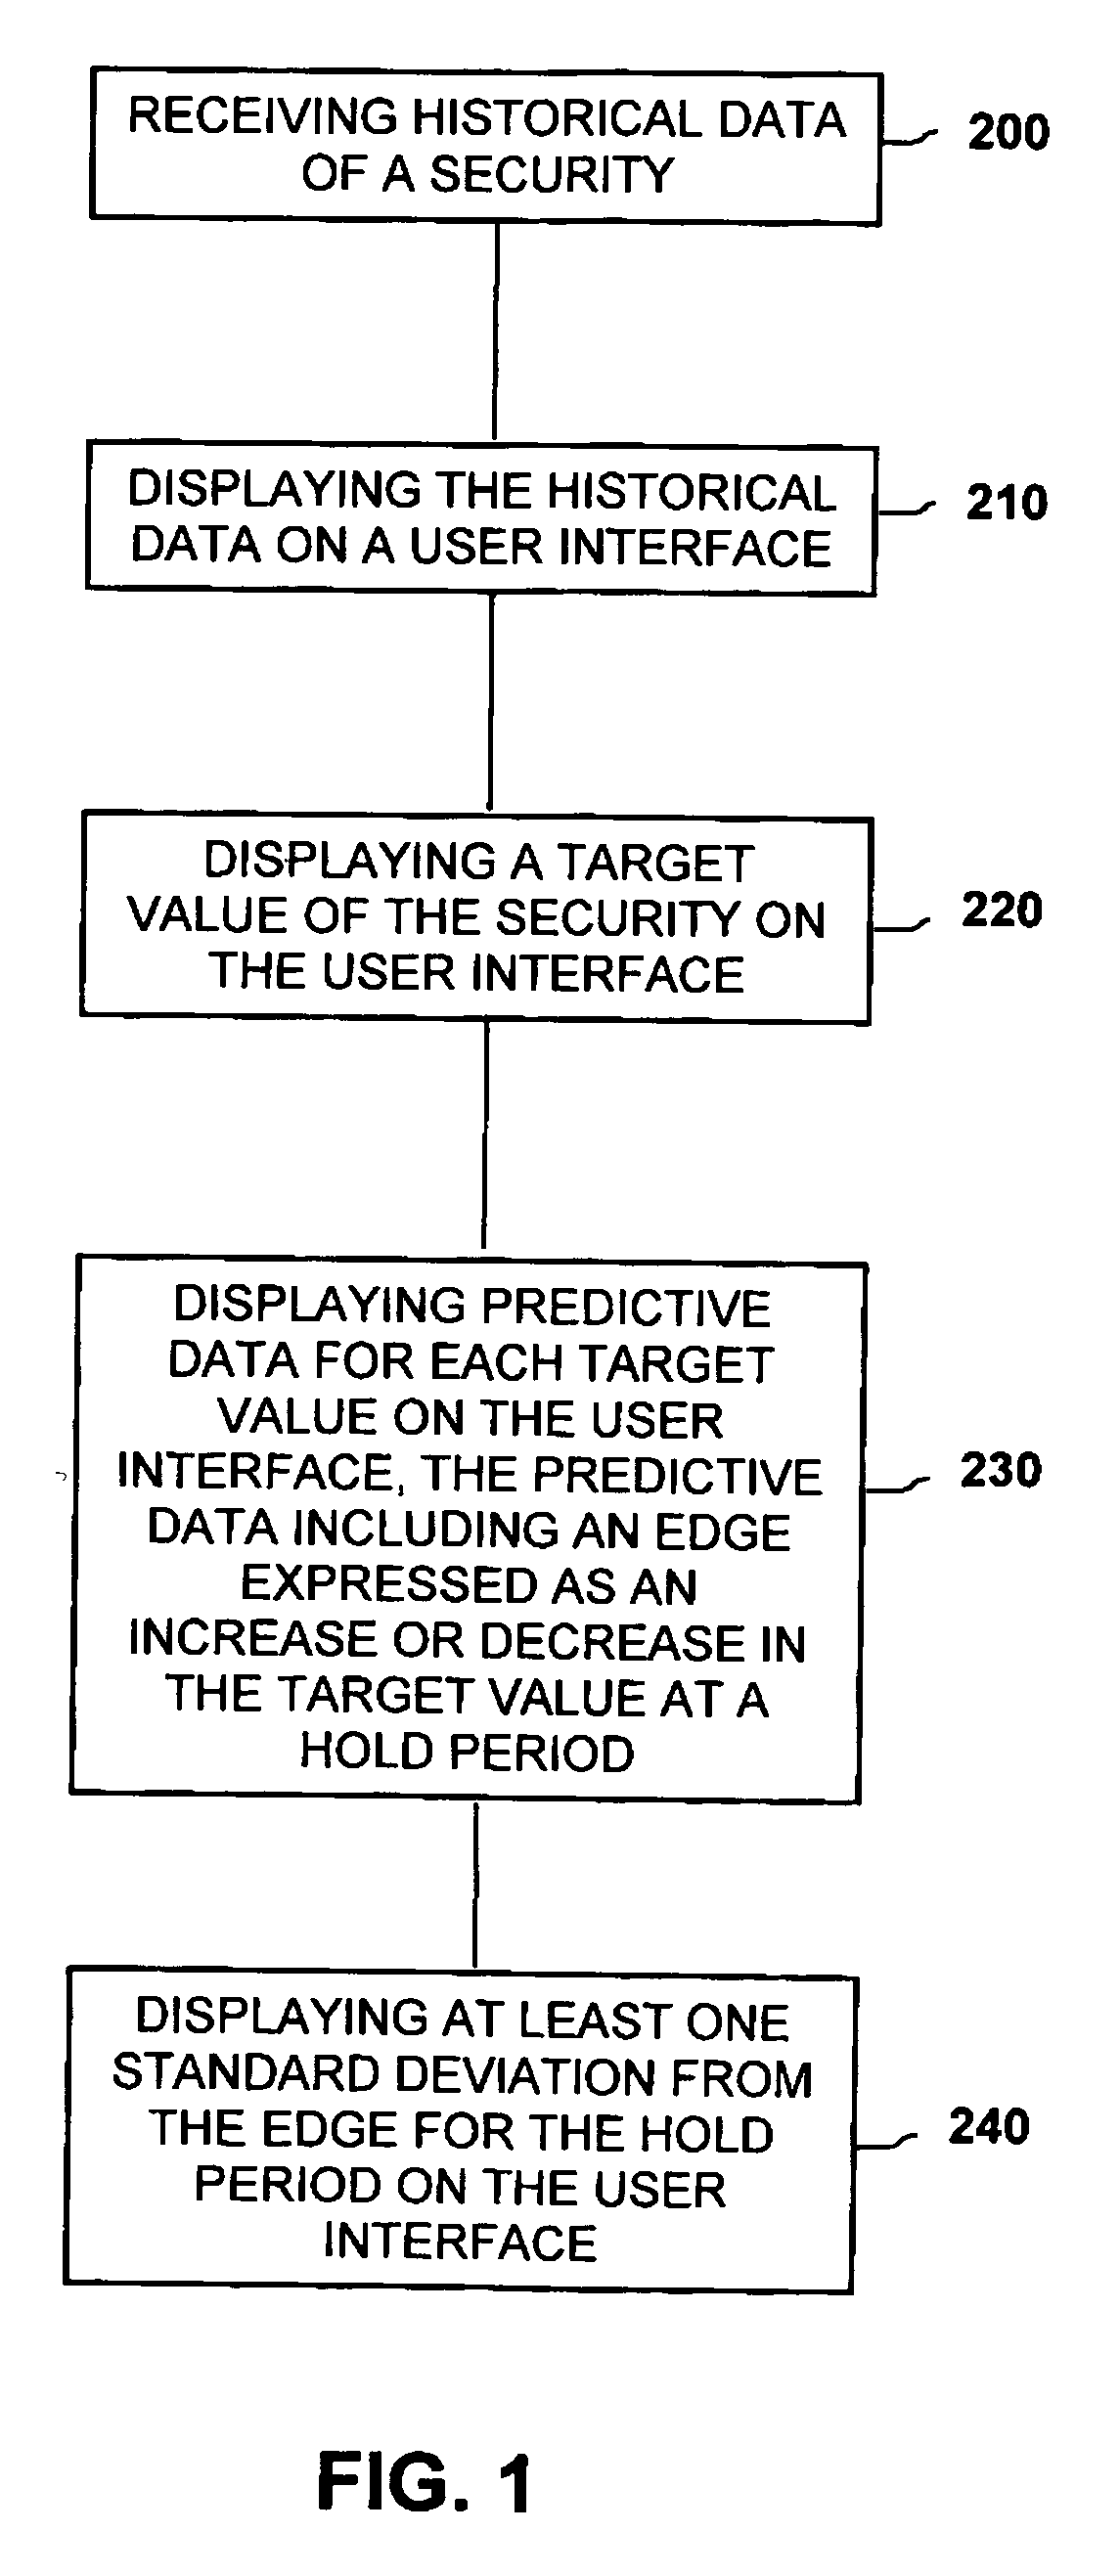
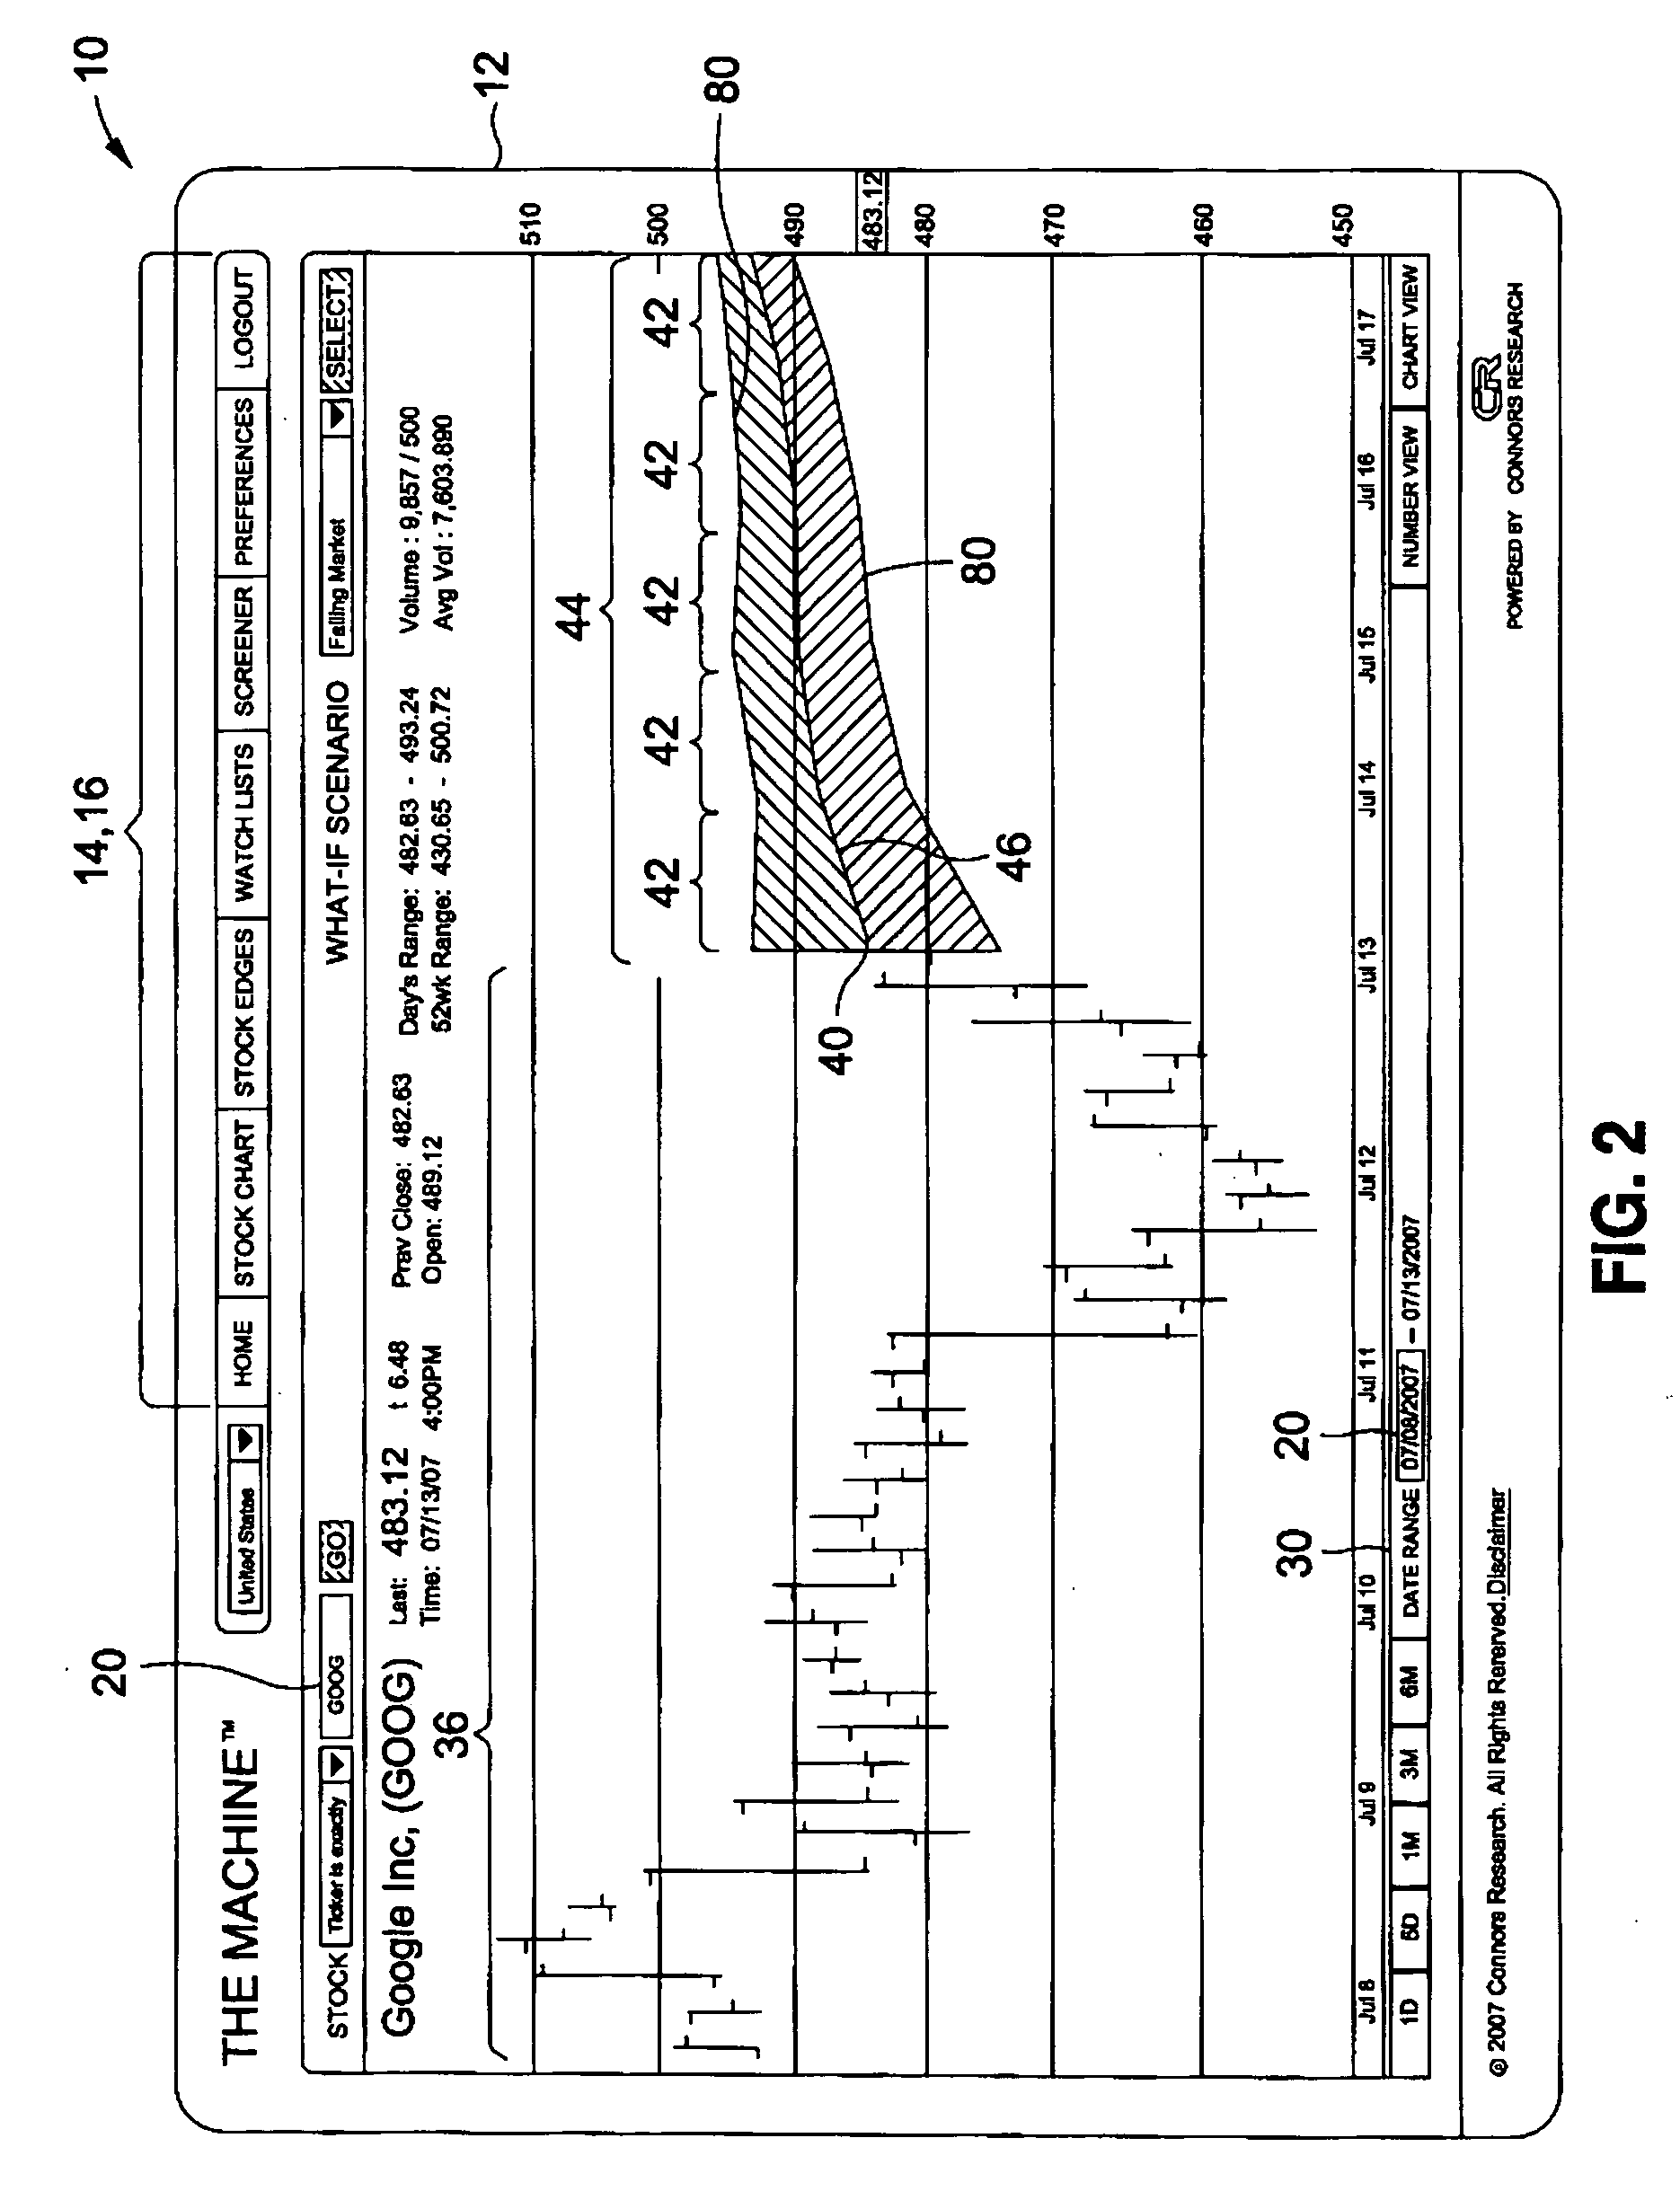
[0031]Referring now to the drawings wherein the showings are for purposes of illustrating preferred embodiments of the present invention only and not for purposes of limiting the same, FIG. 1 is a flow chart illustrating implementation of a method of presenting predictive data 44 of a security such as a stock wherein such predictive data 44 is based upon historical data 36 and wherein standard deviation 80 data may also be presented. As can be seen in FIGS. 2-4 and as described in greater detail below, predictive data 44 is preferably presented on a display window 12 of a graphical user interface 10 (GUI) to allow a user such as an individual trader or an institutional trader of financial instruments to observe the predictive data 44 as an aid in making trading decisions. As shown in FIG. 2, the standard deviation 80 data corresponding to the predictive data 44 may be simultaneously displayed as an aid for assessing the risk associated with the trading of a security.

[0032]The predic...


PUM


Abstract

A method of presenting historical and predictive data of a security comprises the steps of displaying the historical data of the security on a user interface. The method further includes displaying a target value of the security. The method may also include displaying incrementally greater and lesser values expressed as a percentage of the target value of the security. The method further includes displaying predictive data for the current price wherein the predictive data includes an edge expressed as an increase or decrease in the current price predicted to occur at the end of a hold period. The method further includes displaying at least one standard deviation from the edge for the hold period on the user interface.

Description

CROSS-REFERENCE TO RELATED APPLICATIONS[0001]This application is related to pending U.S. patent application Ser. No. 11 / 845,236 and entitled, METHOD OF PRESENTING PREDICTIVE DATA OF FINANCIAL SECURITIES, the entire contents of which is incorporated by reference herein.STATEMENT RE: FEDERALLY SPONSORED RESEARCH / DEVELOPMENT[0002](Not Applicable)BACKGROUND[0003]The present invention relates generally to the trading of financial instruments and, more particularly, to a method of presenting predictive data such as predicted changes in the price of a security as a means for profiting from trading (i.e., buying and selling) of the security.[0004]Included in the prior art are a wide range of techniques and systems for trading various types of financial instruments and securities such as stocks, bonds, currencies, options, futures, and derivatives. One of the more conservative trading techniques is the “buy-and-hold” technique which is a long term trading approach. The buy-and-hold technique...

Claims


Application Information

Patent Timeline
IPC IPC(8): G06Q40/00
CPCG06Q40/06G06Q40/04
Inventor CONNORS, LAURENCE A.ALVAREZ, CESAR
Owner CONNORS RES
Why Eureka
Try Eureka