Method and apparatus for analyzing individual and comparative returns on assets

a technology of individual and comparative returns and methods, applied in the field of methods for analyzing and displaying returns, can solve the problems of limited usefulness, method limitations, and many newer investors who do not understand some of the basics of investing

Inactive Publication Date: 2009-10-15
WALLMAN STEVEN M H
View PDF12 Cites 24 Cited by
  • Summary
  • Abstract
  • Description
  • Claims
  • Application Information

AI Technical Summary

Benefits of technology

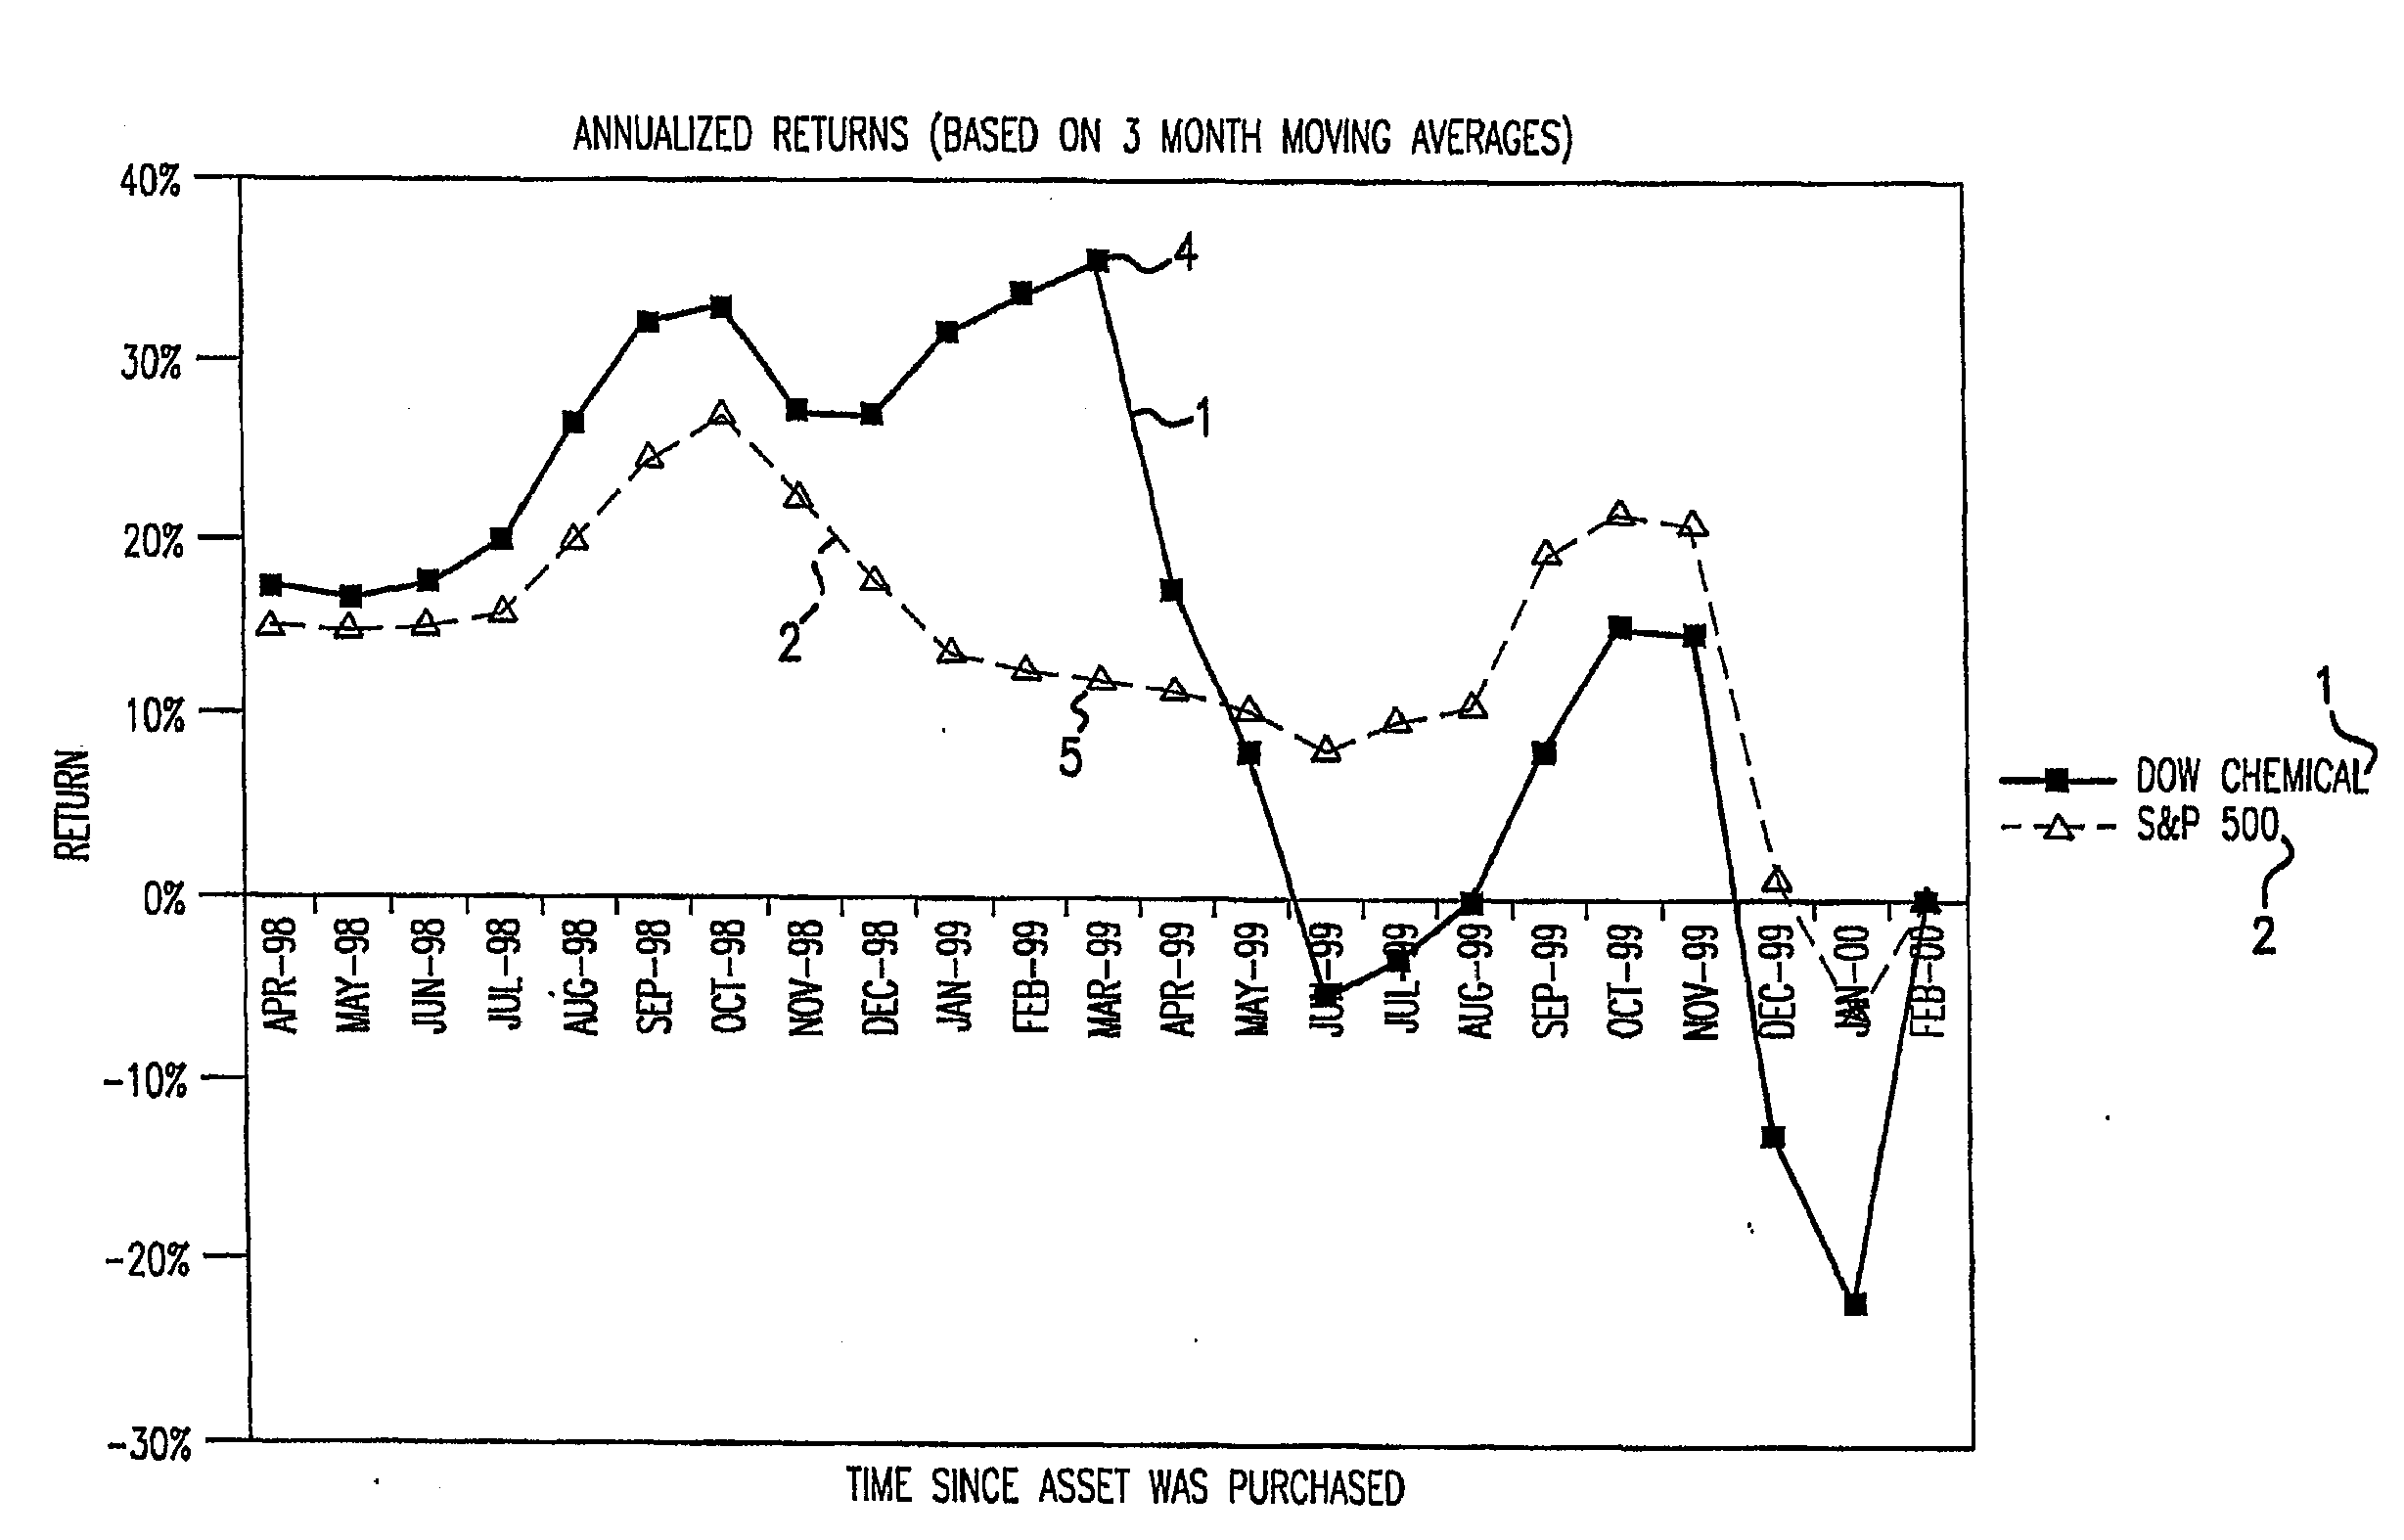
[0013]The present invention solves this problem by analyzing and displaying historical returns in an easy-to-read format. According to one exemplary embodiment of the present invention, historical time is shown along one axis, such

Problems solved by technology

Unfortunately, many of the newer investors do not understand some of the basics of investing.
Techniques for presenting and comparing historical returns of assets exist, but are seriously limited in their usefulness, which to date investors have been forced to accept.
This method has several limitations.
This calculation limits the rate at which a reader can analyze potential investments.
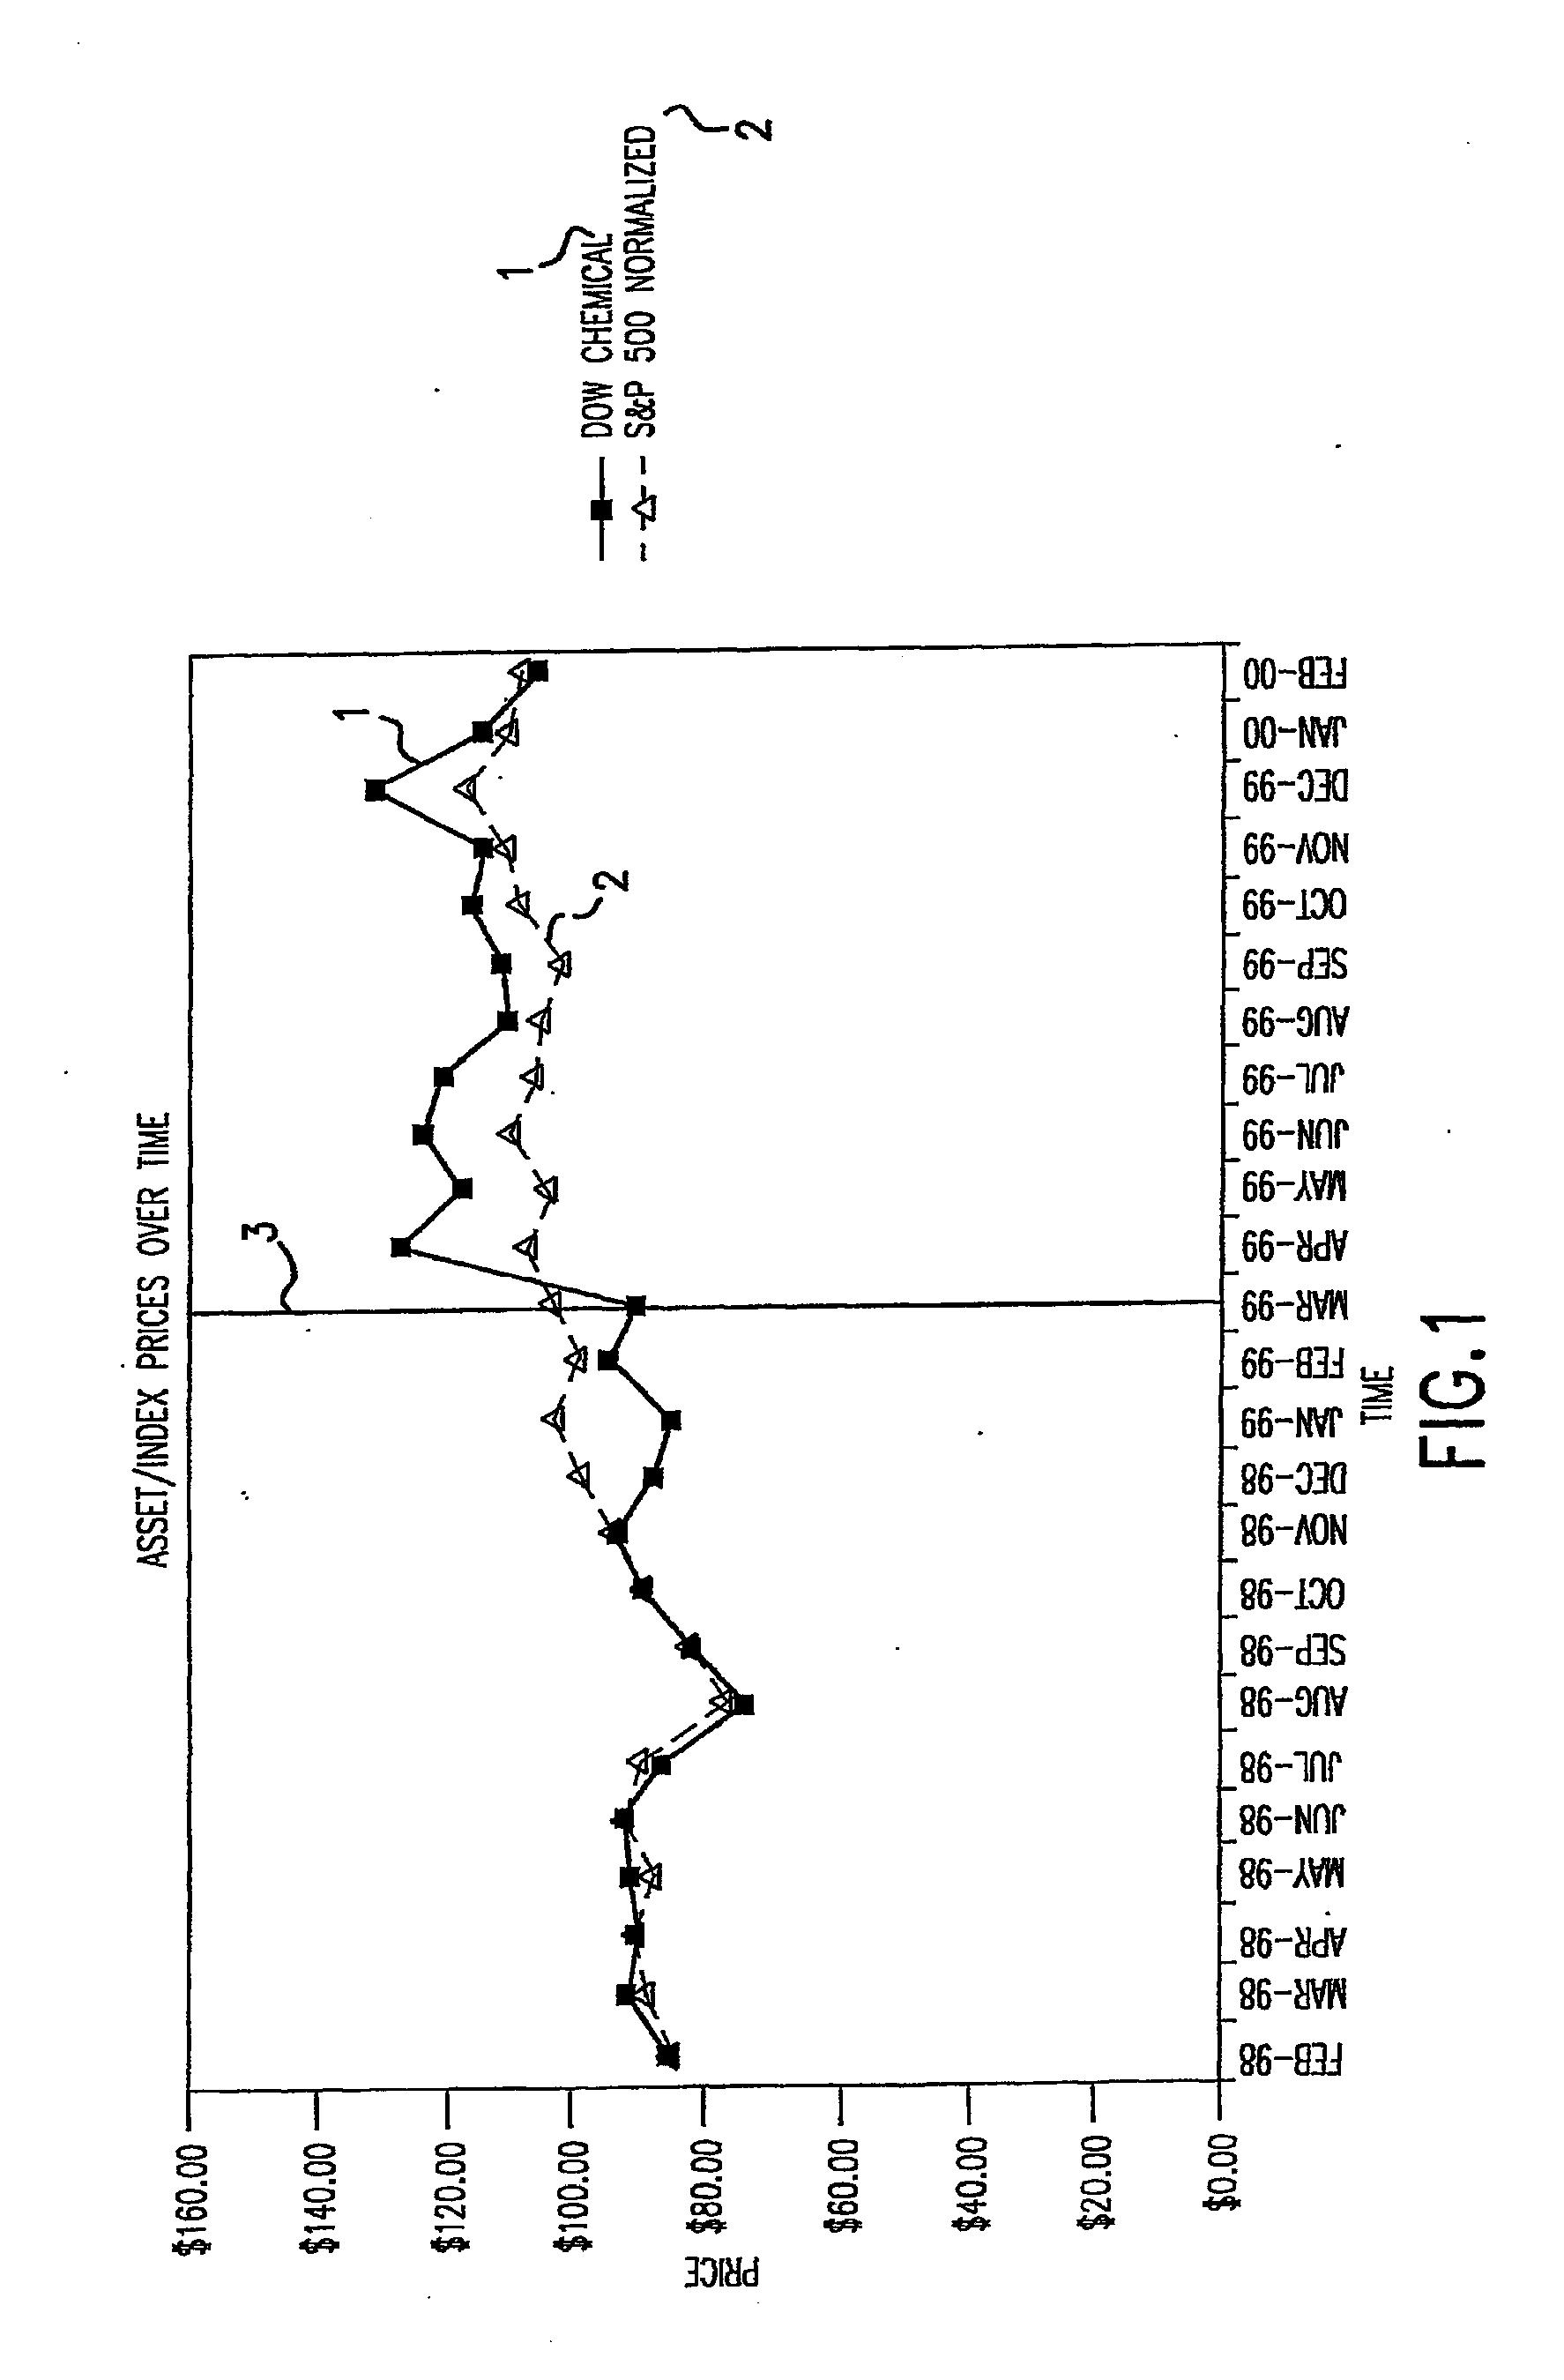
Another problem with these plots is that the moment in time selected for the normalization point significantly affects the relative performance of the asset in question relative to another asset to which the former asset is being compared.
As the market has become more volatile, this problem becomes more significant, and the res

Method used


Image

  • Method and apparatus for analyzing individual and comparative returns on assets
  • Method and apparatus for analyzing individual and comparative returns on assets
  • Method and apparatus for analyzing individual and comparative returns on assets

Examples


absolute returns embodiment

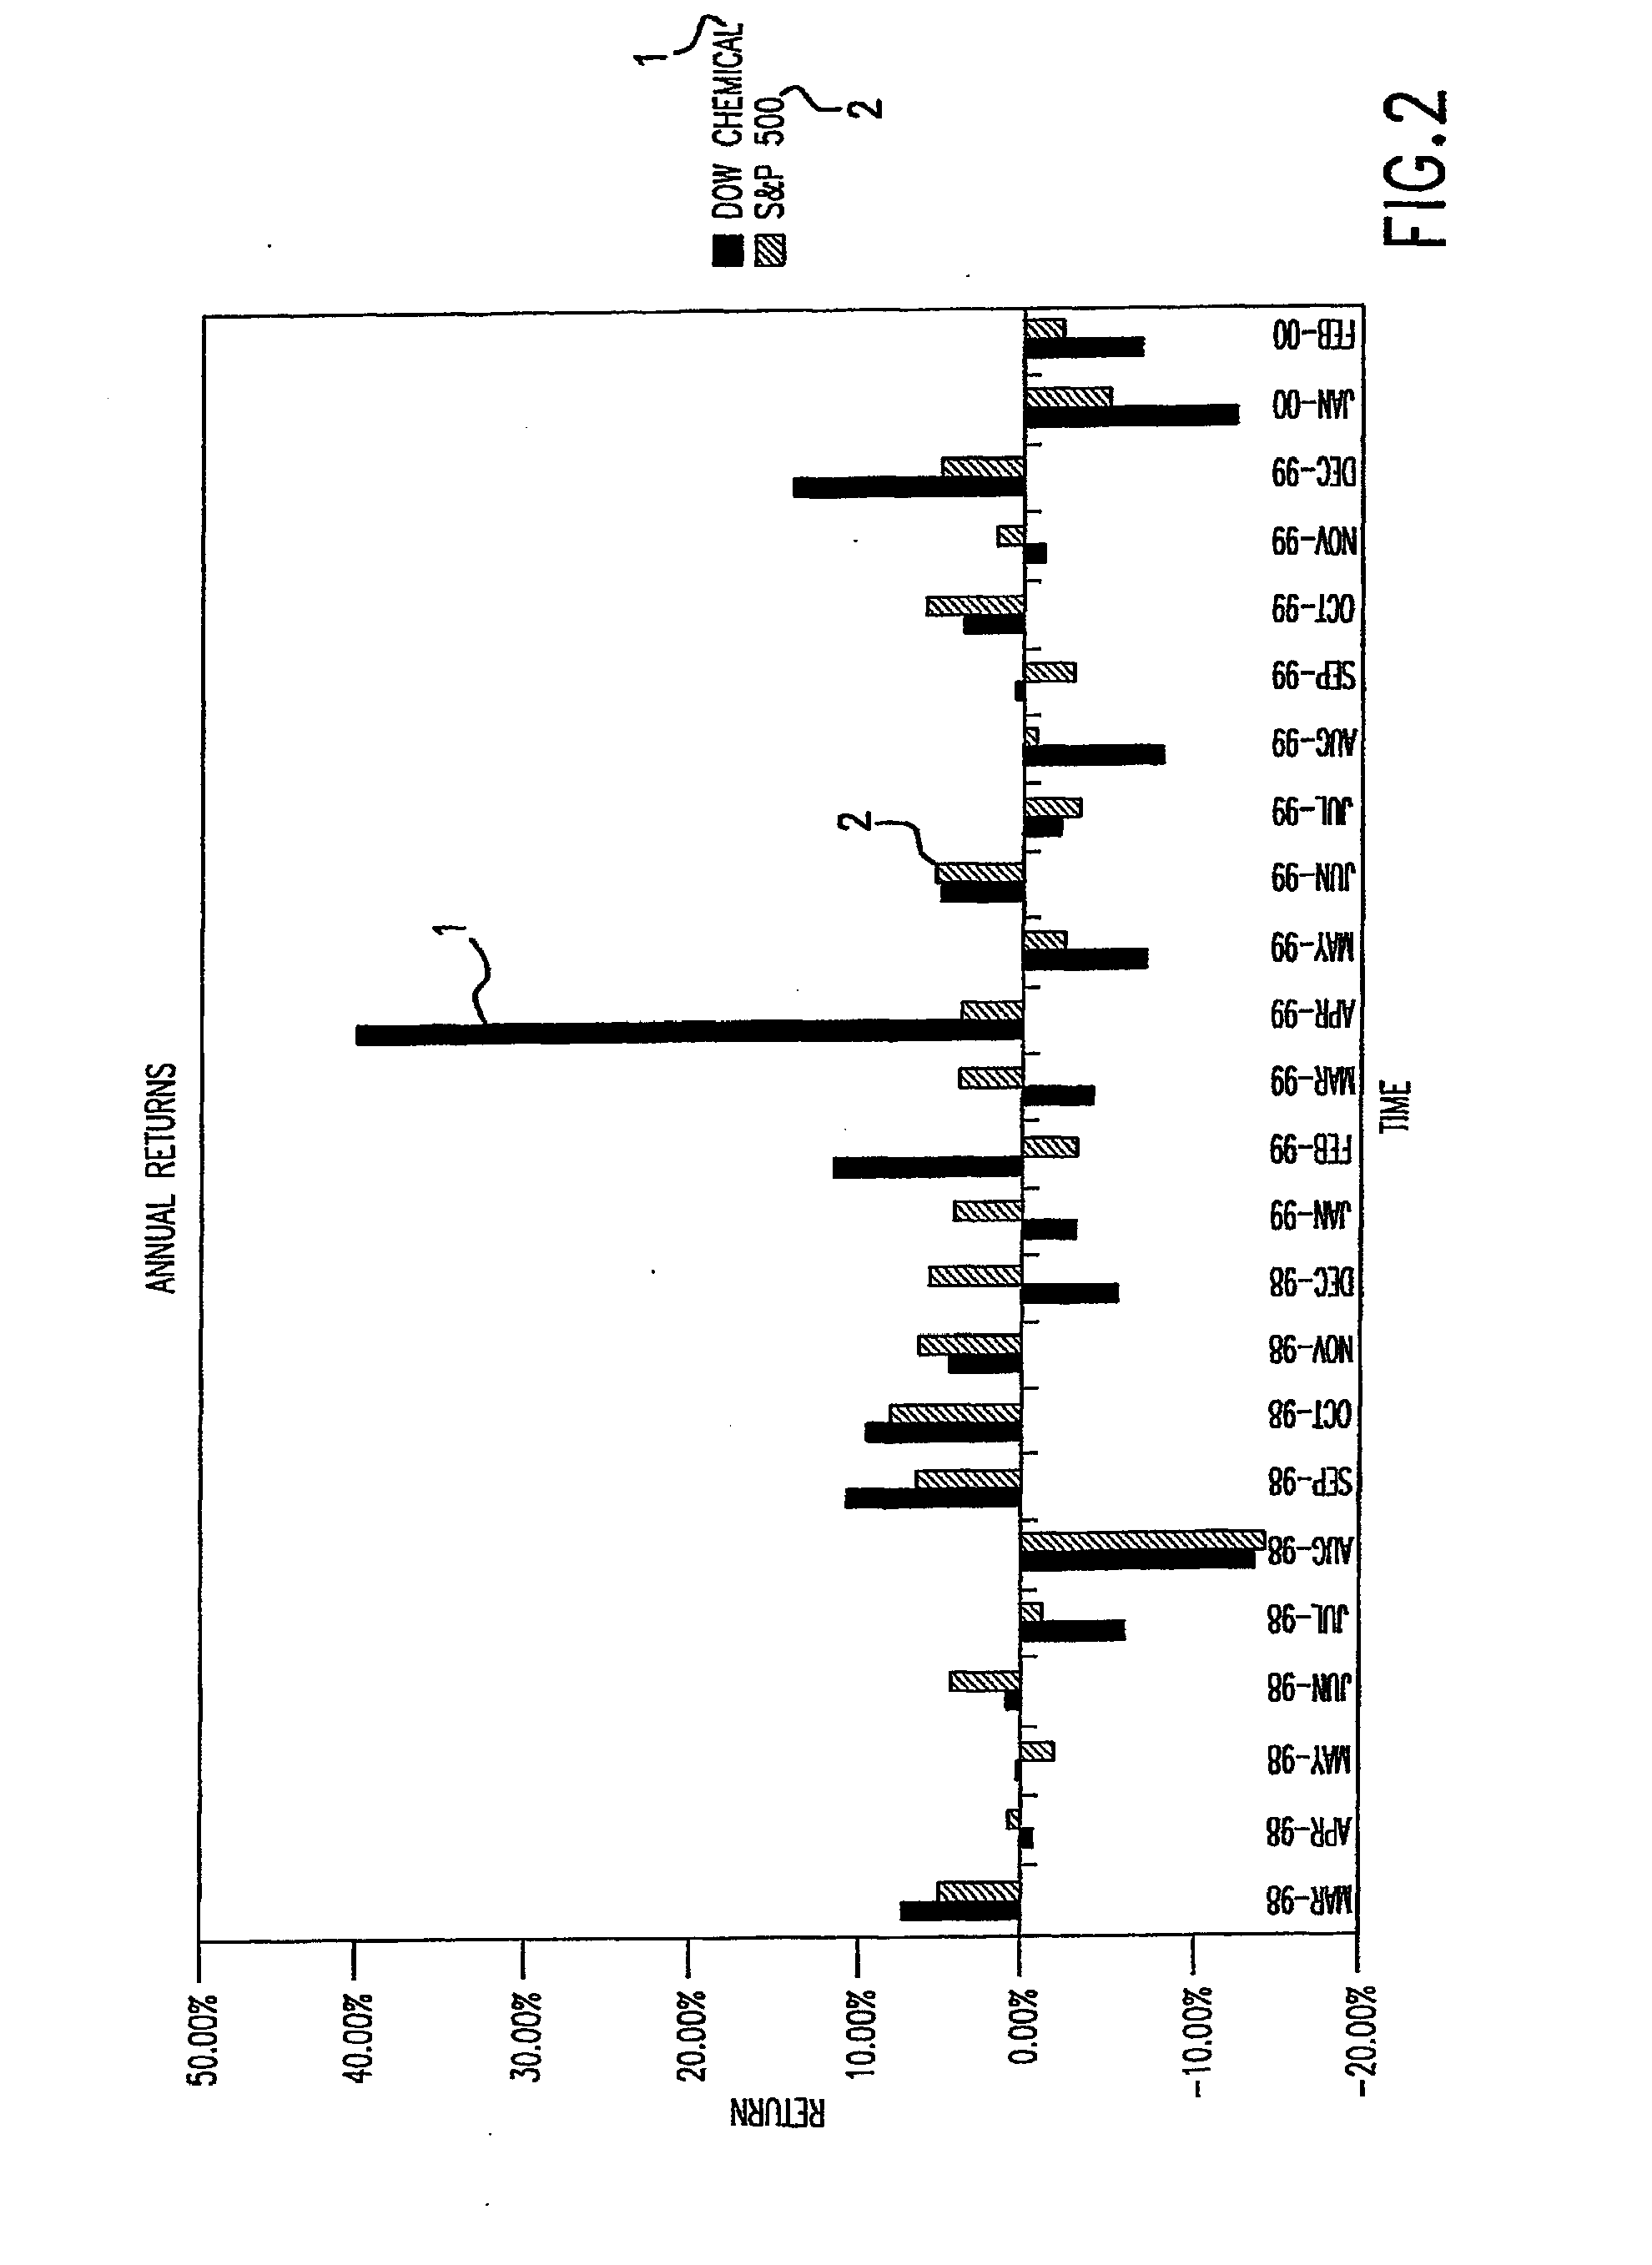
[0031]According to one exemplary embodiment of a method for graphing returns, any one asset's or index's returns are plotted along the X- and Y-axes as follows:[0032]The price of the asset or the value of the index at each point in historical time (Pt−n) is subtracted from the current price (Pt) to yield a result, as follows: (Pt−Pt−n).[0033]The result is divided by the historical price to arrive at the absolute return ratio as follows: R=(Pt−Pt−n / Pt−n).[0034]The absolute return ratio is converted to an absolute return by multiplying by 100% as follows: Y=(R)−*100%.[0035]This return is then plotted on the graph.[0036]This process is repeated for different points—or every point—in historical time to yield the final graph. See, for example, FIG. 3, in which each square represents a historical price and the return for each historical price is calculated as set forth above. For example, in March 1999, Dow Chemical had an absolute return 4 of about 20% and the S&P 500 had an absolute ret...


PUM


Abstract

A computer implementable graphical method and apparatus for presenting historical returns of one or more assets, liabilities, and/or indices is disclosed. A computer can plot an historical returns (in percentages) versus historical time for one or more user selectable assets, liabilities, or indices. Each historical return can be obtained by subtracting an historical price from a current price, and dividing the result by the historical price to obtain a ratio, which is multiplied by 100 percent. Alternatively, the historical return can be obtained by applying the described technique to a moving average historical price.

Description

CROSS-REFERENCE TO RELATED APPLICATIONS[0001]This is a continuation of application Ser. No. 09 / 573,230 filed 19 May 2000, the content of which is incorporated herein by reference in its entirety.BACKGROUND OF THE INVENTION[0002]The present invention relates generally to methods for analyzing and displaying returns on assets or liabilities to consumers of financial information, including current and potential investors, securities analysts, securities broker-dealers, financial planners, and finance professionals. More particularly, the present invention relates to a method for analyzing and displaying returns on assets to consumers of financial information that may be implemented on a graphical user interface of a computer accessing databases of current and historical asset or liability values and / or index values for comparative performance analysis.[0003]The absolute numbers of investors holding assets or liabilities, including securities and other instruments, is currently at an al...

Claims


Application Information

Patent Timeline
IPC IPC(8): G06Q40/00
CPCG06Q40/00G06Q40/06G06Q40/02
Inventor WALLMAN, STEVEN M.H.
Owner WALLMAN STEVEN M H
Why Eureka
Try Eureka