Methods of Displaying Expense Allocated to Employees for a Plurality of Projects

a technology of expense allocation and project, applied in the field of graphing the reporting structure of large organizations, can solve the problems of difficult understanding the flow of projects in large organizations, cumbersome charts for larger organizations,

Inactive Publication Date: 2016-05-26
LEXMARK INT INC
View PDF1 Cites 1 Cited by
  • Summary
  • Abstract
  • Description
  • Claims
  • Application Information

AI Technical Summary

Benefits of technology

[0010]The invention, in another form thereof, is directed to a method of generating and displaying an animation of an organization's employees allocated to one or more of a plurality of projects. The method includes generating a series of organization maps of the organization showing the organization over a period of time. The series includes a historic organization map and a projected organization map. The organization maps include nodes representing individual employees. For each node in each organization map, set the color of the node...

Problems solved by technology

However, such charts become cumbersome for larger organizations as the lower rows become progressively longer.
Understanding the flow of projects is difficult in ...

Method used


Image

  • Methods of Displaying Expense Allocated to Employees for a Plurality of Projects
  • Methods of Displaying Expense Allocated to Employees for a Plurality of Projects
  • Methods of Displaying Expense Allocated to Employees for a Plurality of Projects

Examples


Embodiment Construction

[0015]In the following description, reference is made to the accompanying drawings where like numerals represent like elements. The embodiments are described in sufficient detail to enable those skilled in the art to practice the present disclosure. Examples merely typify possible variations. Portions and features of some embodiments may be included in or substituted for those of others. The following description, therefore, is not to be taken in a limiting sense and the scope of the present disclosure is defined only by the appended claims and their equivalents.

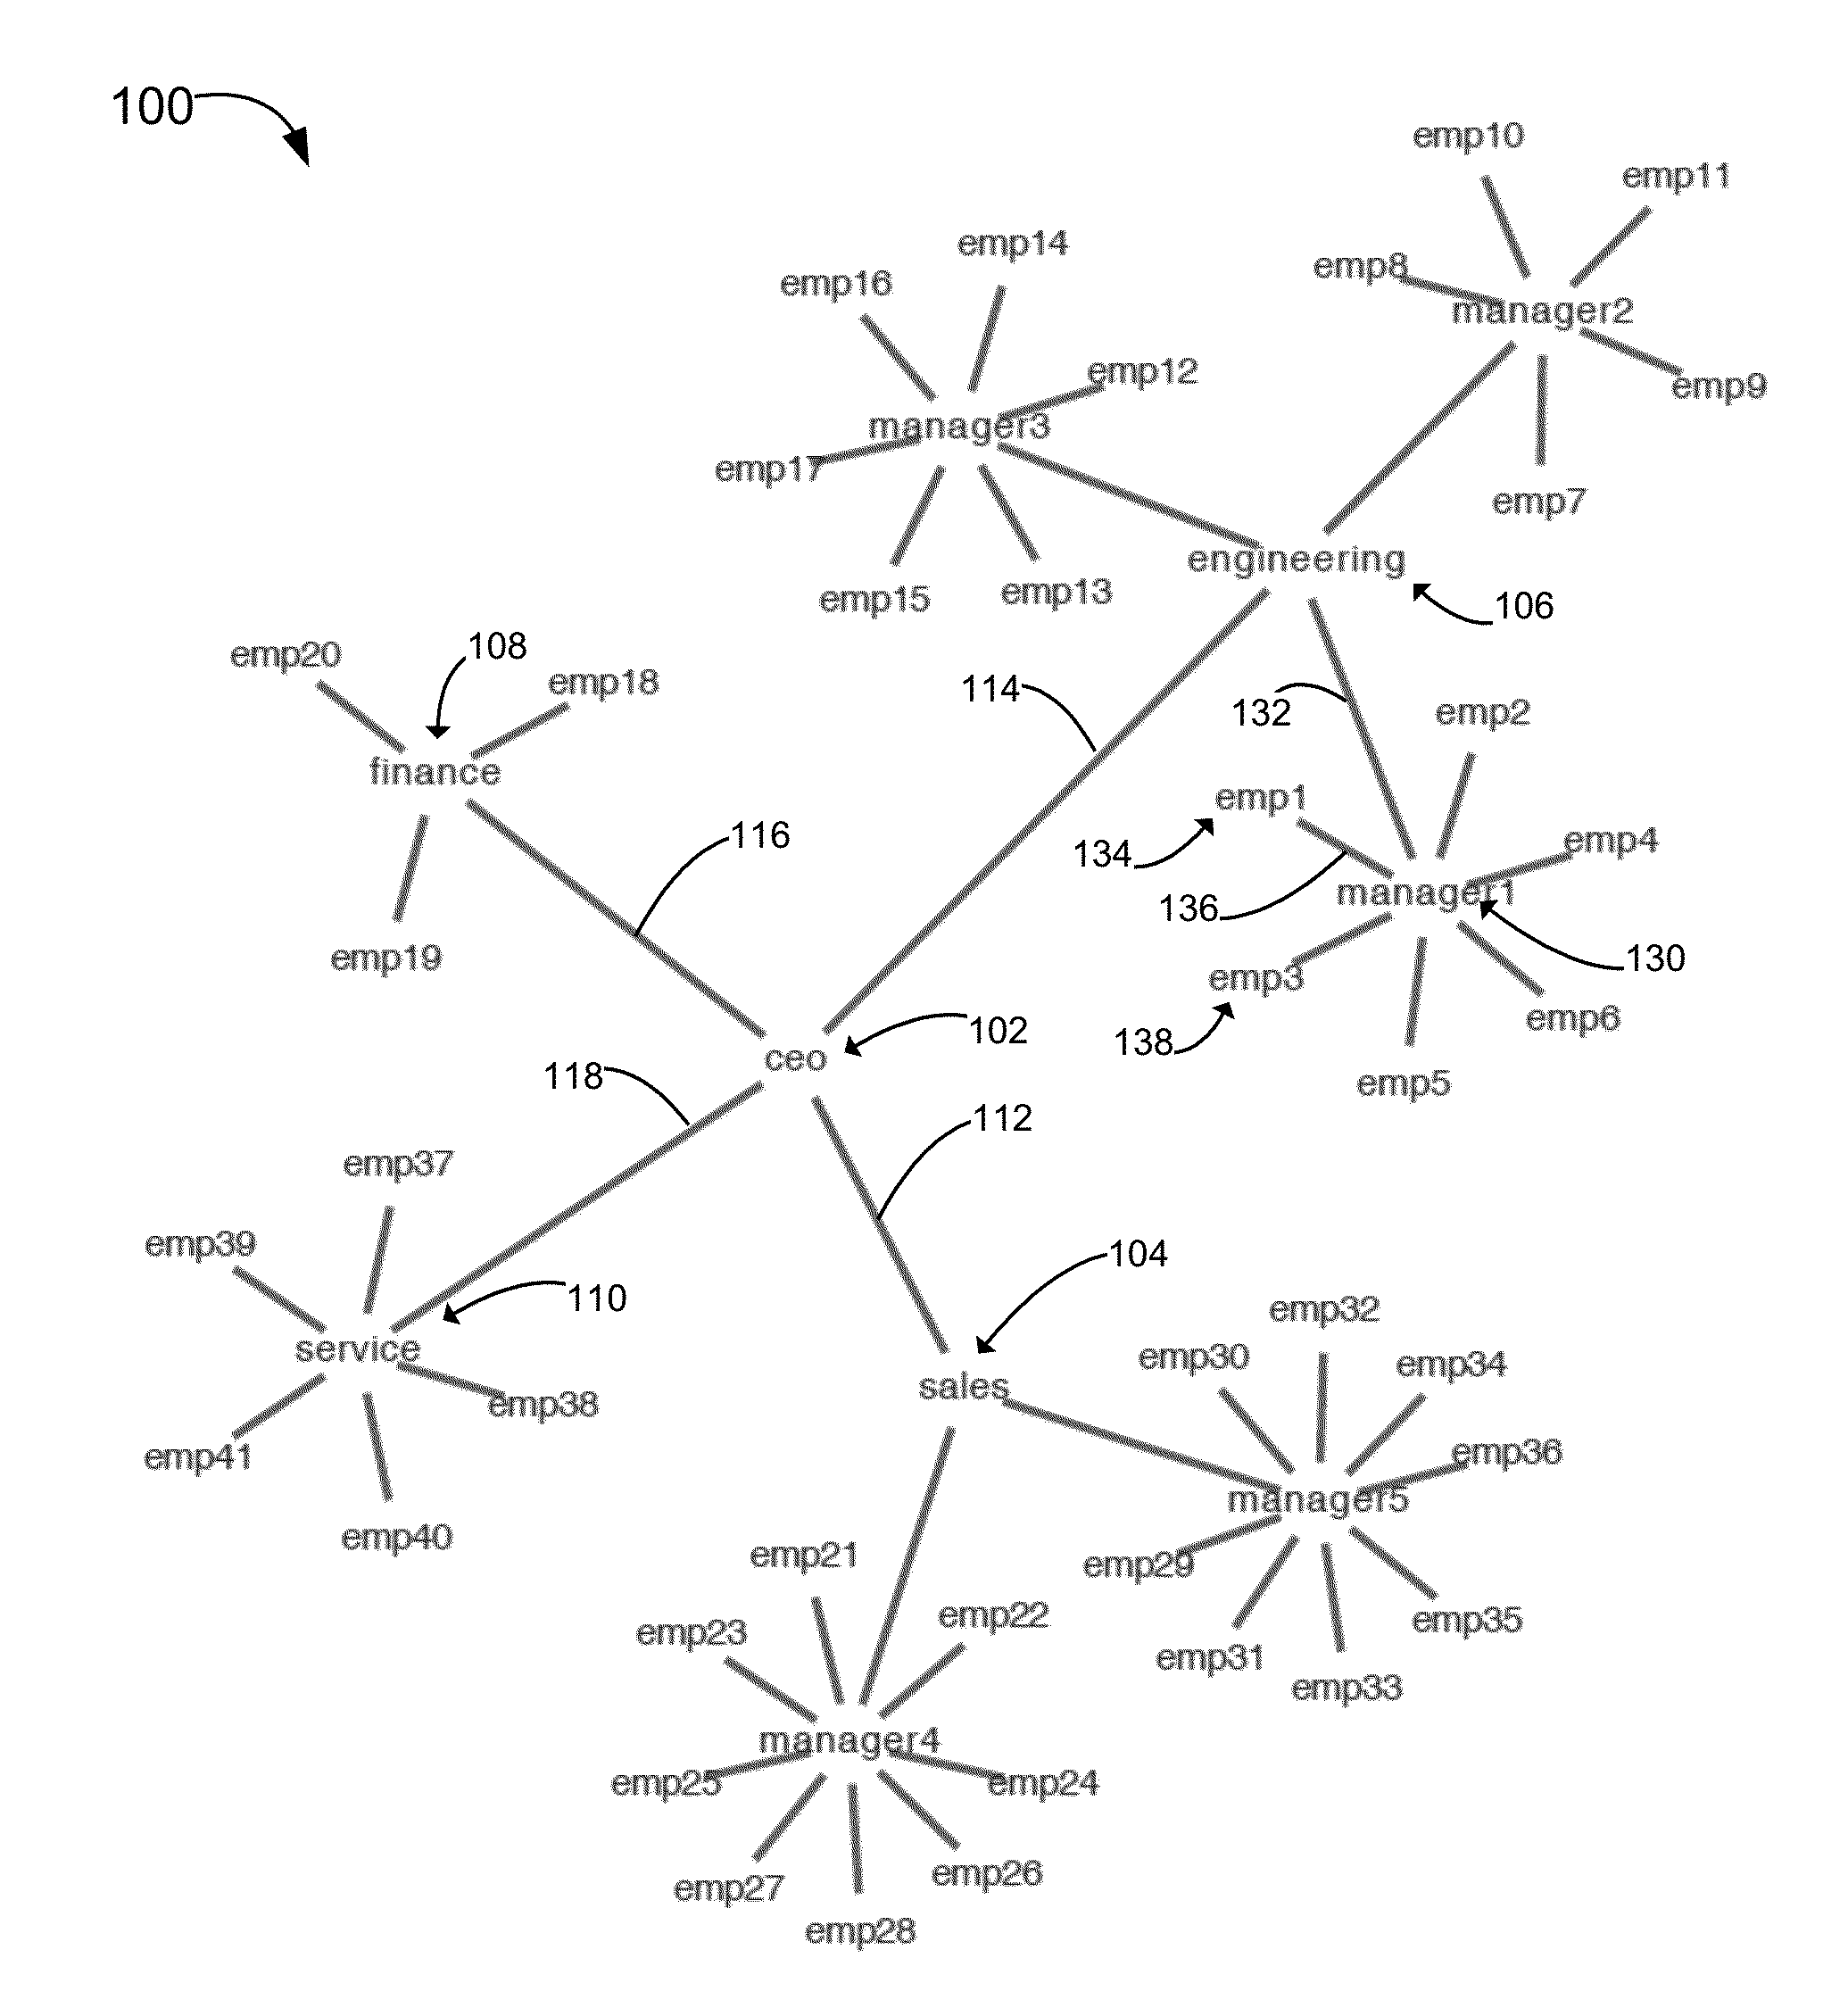
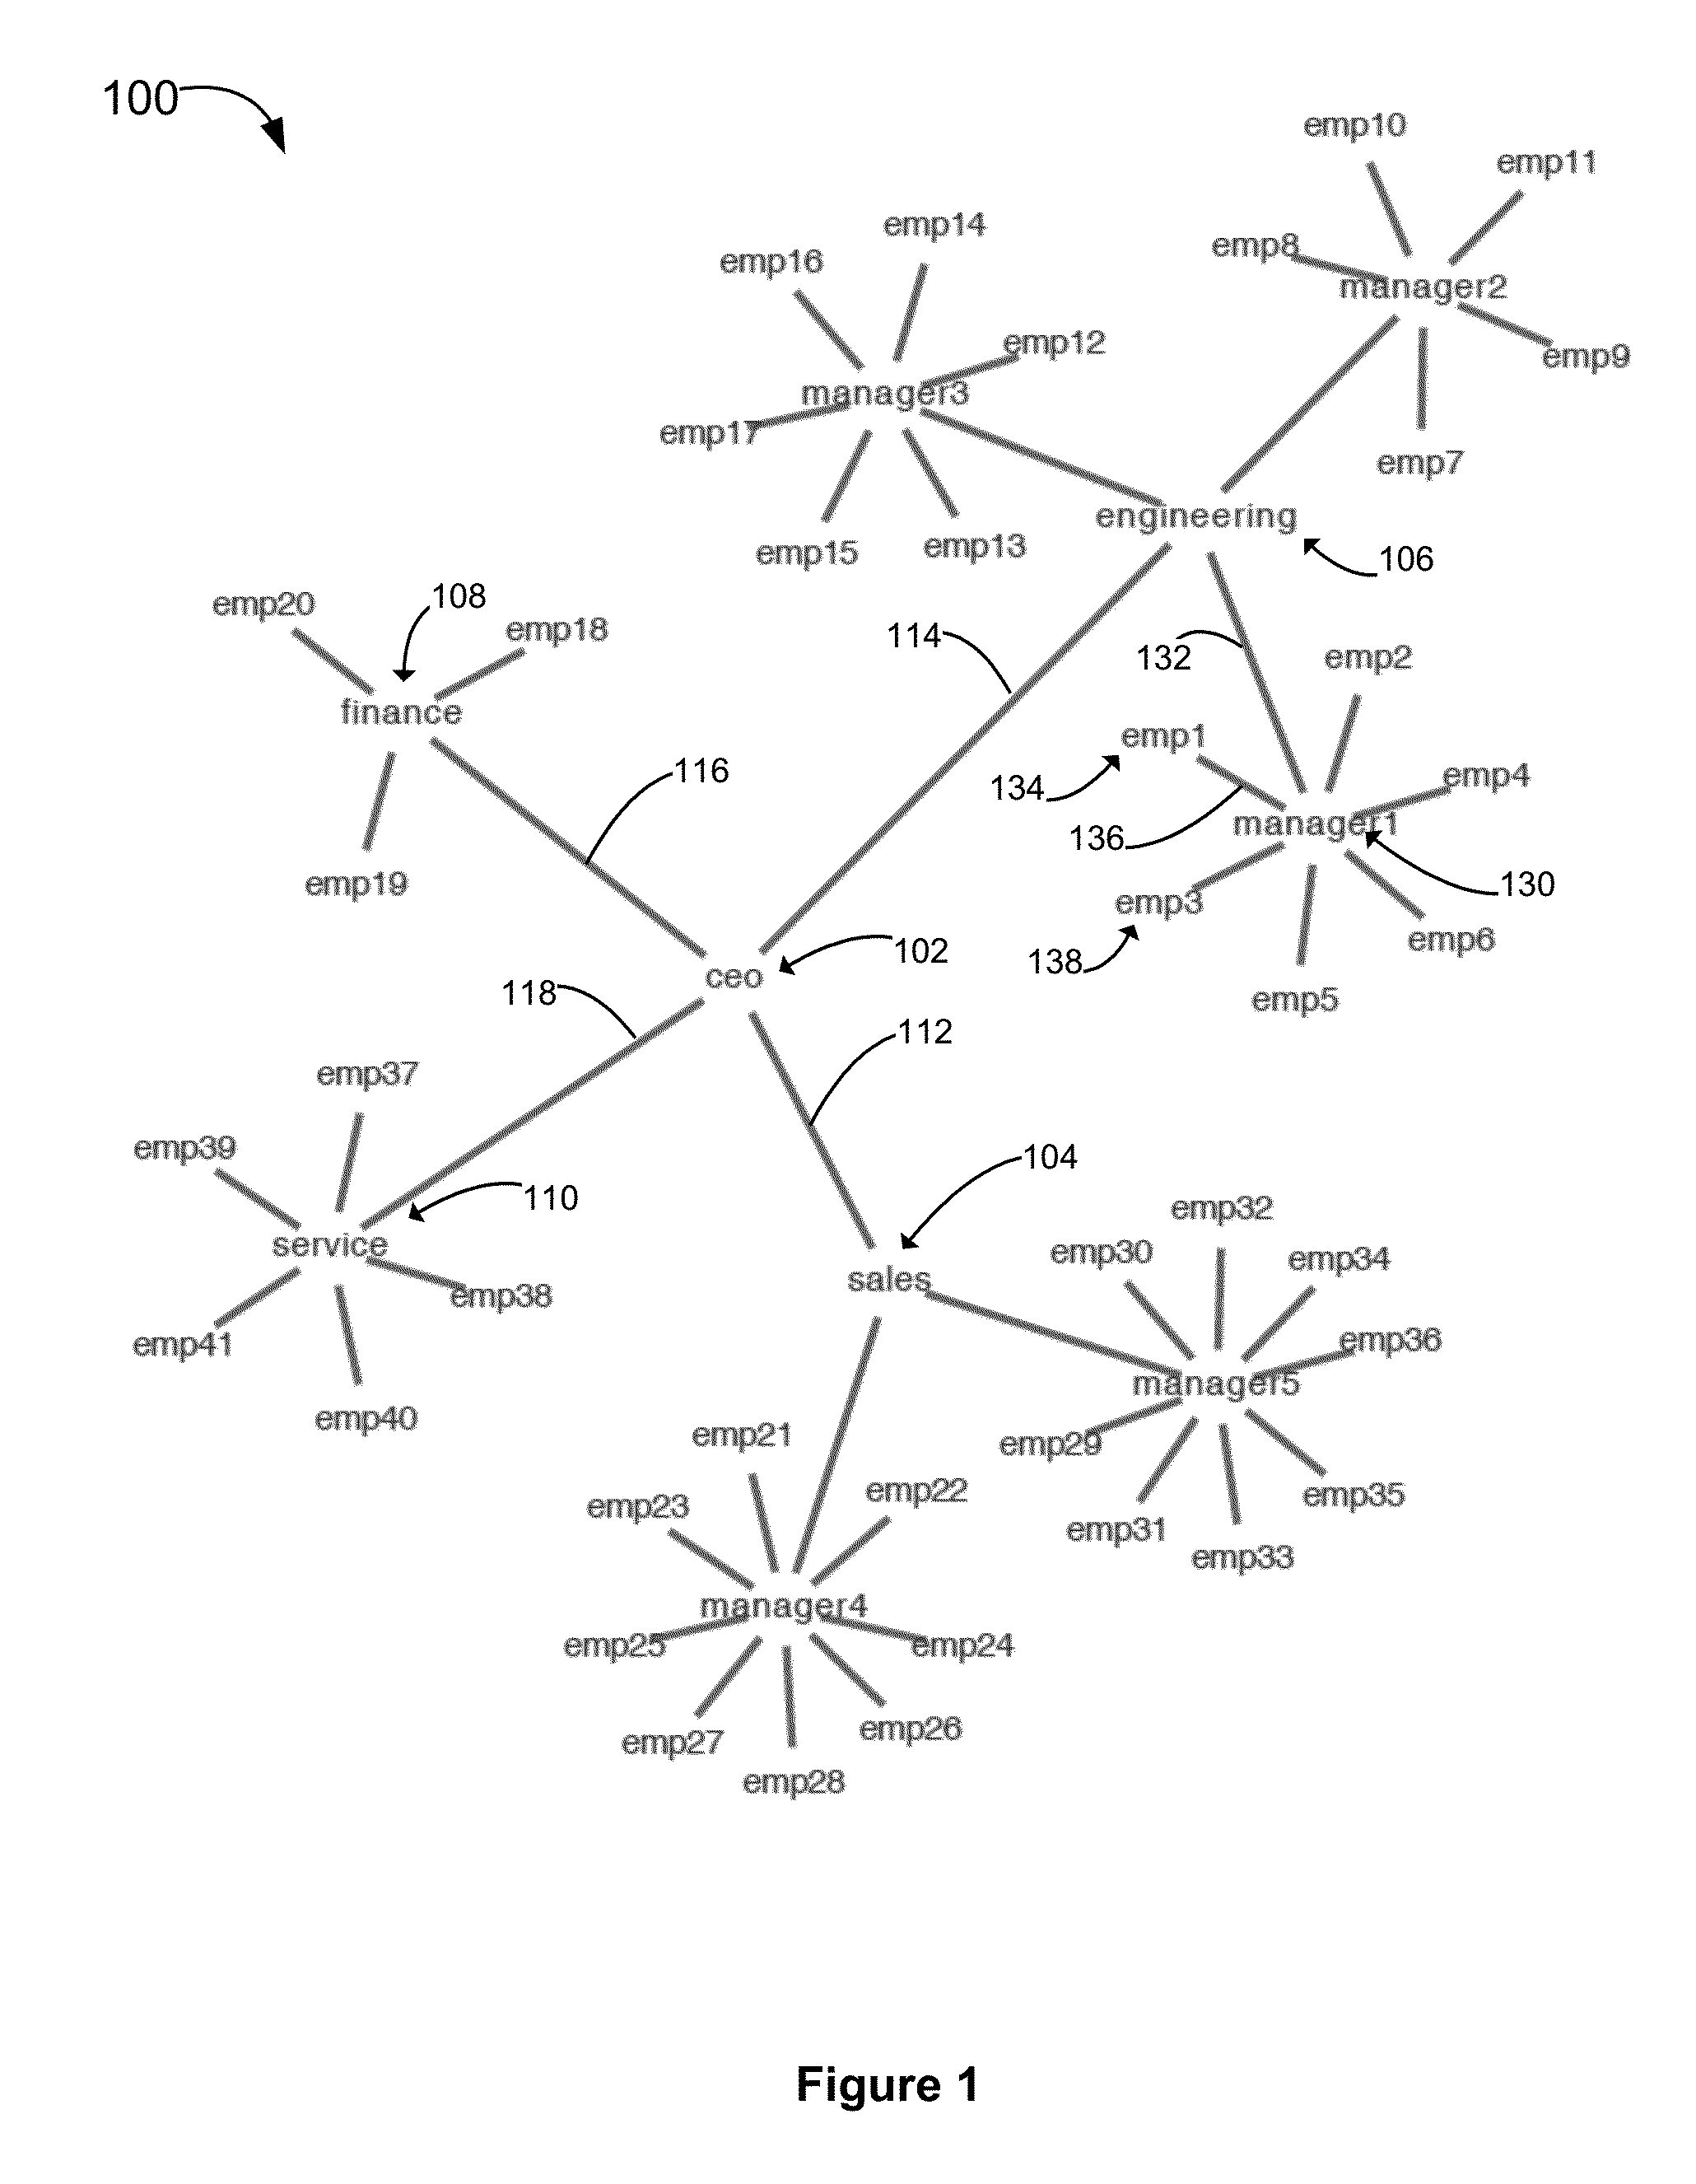
[0016]Referring now to the drawings and more particularly to FIG. 1, there is shown a map of an organization (org map) 100 that was generated using a network mapping algorithm. The org map 100 was generated using an algorithm known as a “circular” algorithm which generates spokes radiating around the perimeter of hubs. For mapping large organizations, for example organizations with more than one thousand employees, a circula...


PUM


Abstract

A method of generating and displaying an animation of an organization's employees allocated to one or more of a plurality of projects is disclosed. The method includes generating a series of organization maps of the organization showing the organization over a period of time. The series includes a historic organization map and a projected organization map. The organization maps include nodes representing individual employees. For each node in each organization map, the color of the node is set to a first color if the node's employee is allocated to a first project, a second color if the node's employee is allocated to a second project, and to a third color if the node's employee is allocated to both the first project and the second project. The series of organization maps is displayed on a color monitor as an animation. Other methods are disclosed.

Description

BACKGROUND[0001]1. Field of the Disclosure[0002]The present disclosure relates generally to graphing the reporting structure of large organizations and more particularly to generating and displaying animations of projects as they flow through large organizations.[0003]2. Description of the Related Art[0004]Graphs of the reporting structure of organizations typically take the form of a tree, with the Chief Executive Officer (CEO) at the top of the chart, direct reports to the CEO in a row below the CEO, and lower ranking employees in progressively lower rows. However, such charts become cumbersome for larger organizations as the lower rows become progressively longer. Organizations have been mapped using a hyperbolic network mapping algorithm, with positions in the organization treated as nodes, and lines of authority treated as links. The resulting chart is less cumbersome for larger organizations than is the traditional row and column graph.[0005]These graphs show the reporting str...

Claims


Application Information

Patent Timeline
IPC IPC(8): G06T11/20
CPCG06T11/206
Inventor AHNE, ADAMGOFF, III, WILLIAM GEORGEMCREYNOLDS, JASON TODD
Owner LEXMARK INT INC
Why Eureka
Try Eureka