
Graphing method for presenting values associated with two data sets, graphing apparatus, and computer program product storing a program for executing the graphing method

a graphing method and data set technology, applied in the field of graphs, can solve the problems of not being able to discern variations in neither being able to calculate completion rates nor growth rates, and being unable to calculate completion rates or growth rates

Active Publication Date: 2013-08-13
CHII YING
View PDF3 Cites 0 Cited by
  • Summary
  • Abstract
  • Description
  • Claims
  • Application Information

AI Technical Summary

Problems solved by technology

However, when the denominator is zero, it is neither possible to calculate the completion rate nor the growth rate.
Furthermore, when the denominator used in calculating the completion rate or the growth rate is small, the resulting completion rate or growth rate is a very large value.
However, this may make it impossible to discern variations in the completion rates or growth rates that are not large.
While a marked improvement in this regard is realized with the use of logarithms, it is not possible to obtain the log of zero and negative values.

Method used


Image

  • Graphing method for presenting values associated with two data sets, graphing apparatus, and computer program product storing a program for executing the graphing method
  • Graphing method for presenting values associated with two data sets, graphing apparatus, and computer program product storing a program for executing the graphing method
  • Graphing method for presenting values associated with two data sets, graphing apparatus, and computer program product storing a program for executing the graphing method

Examples


Embodiment Construction

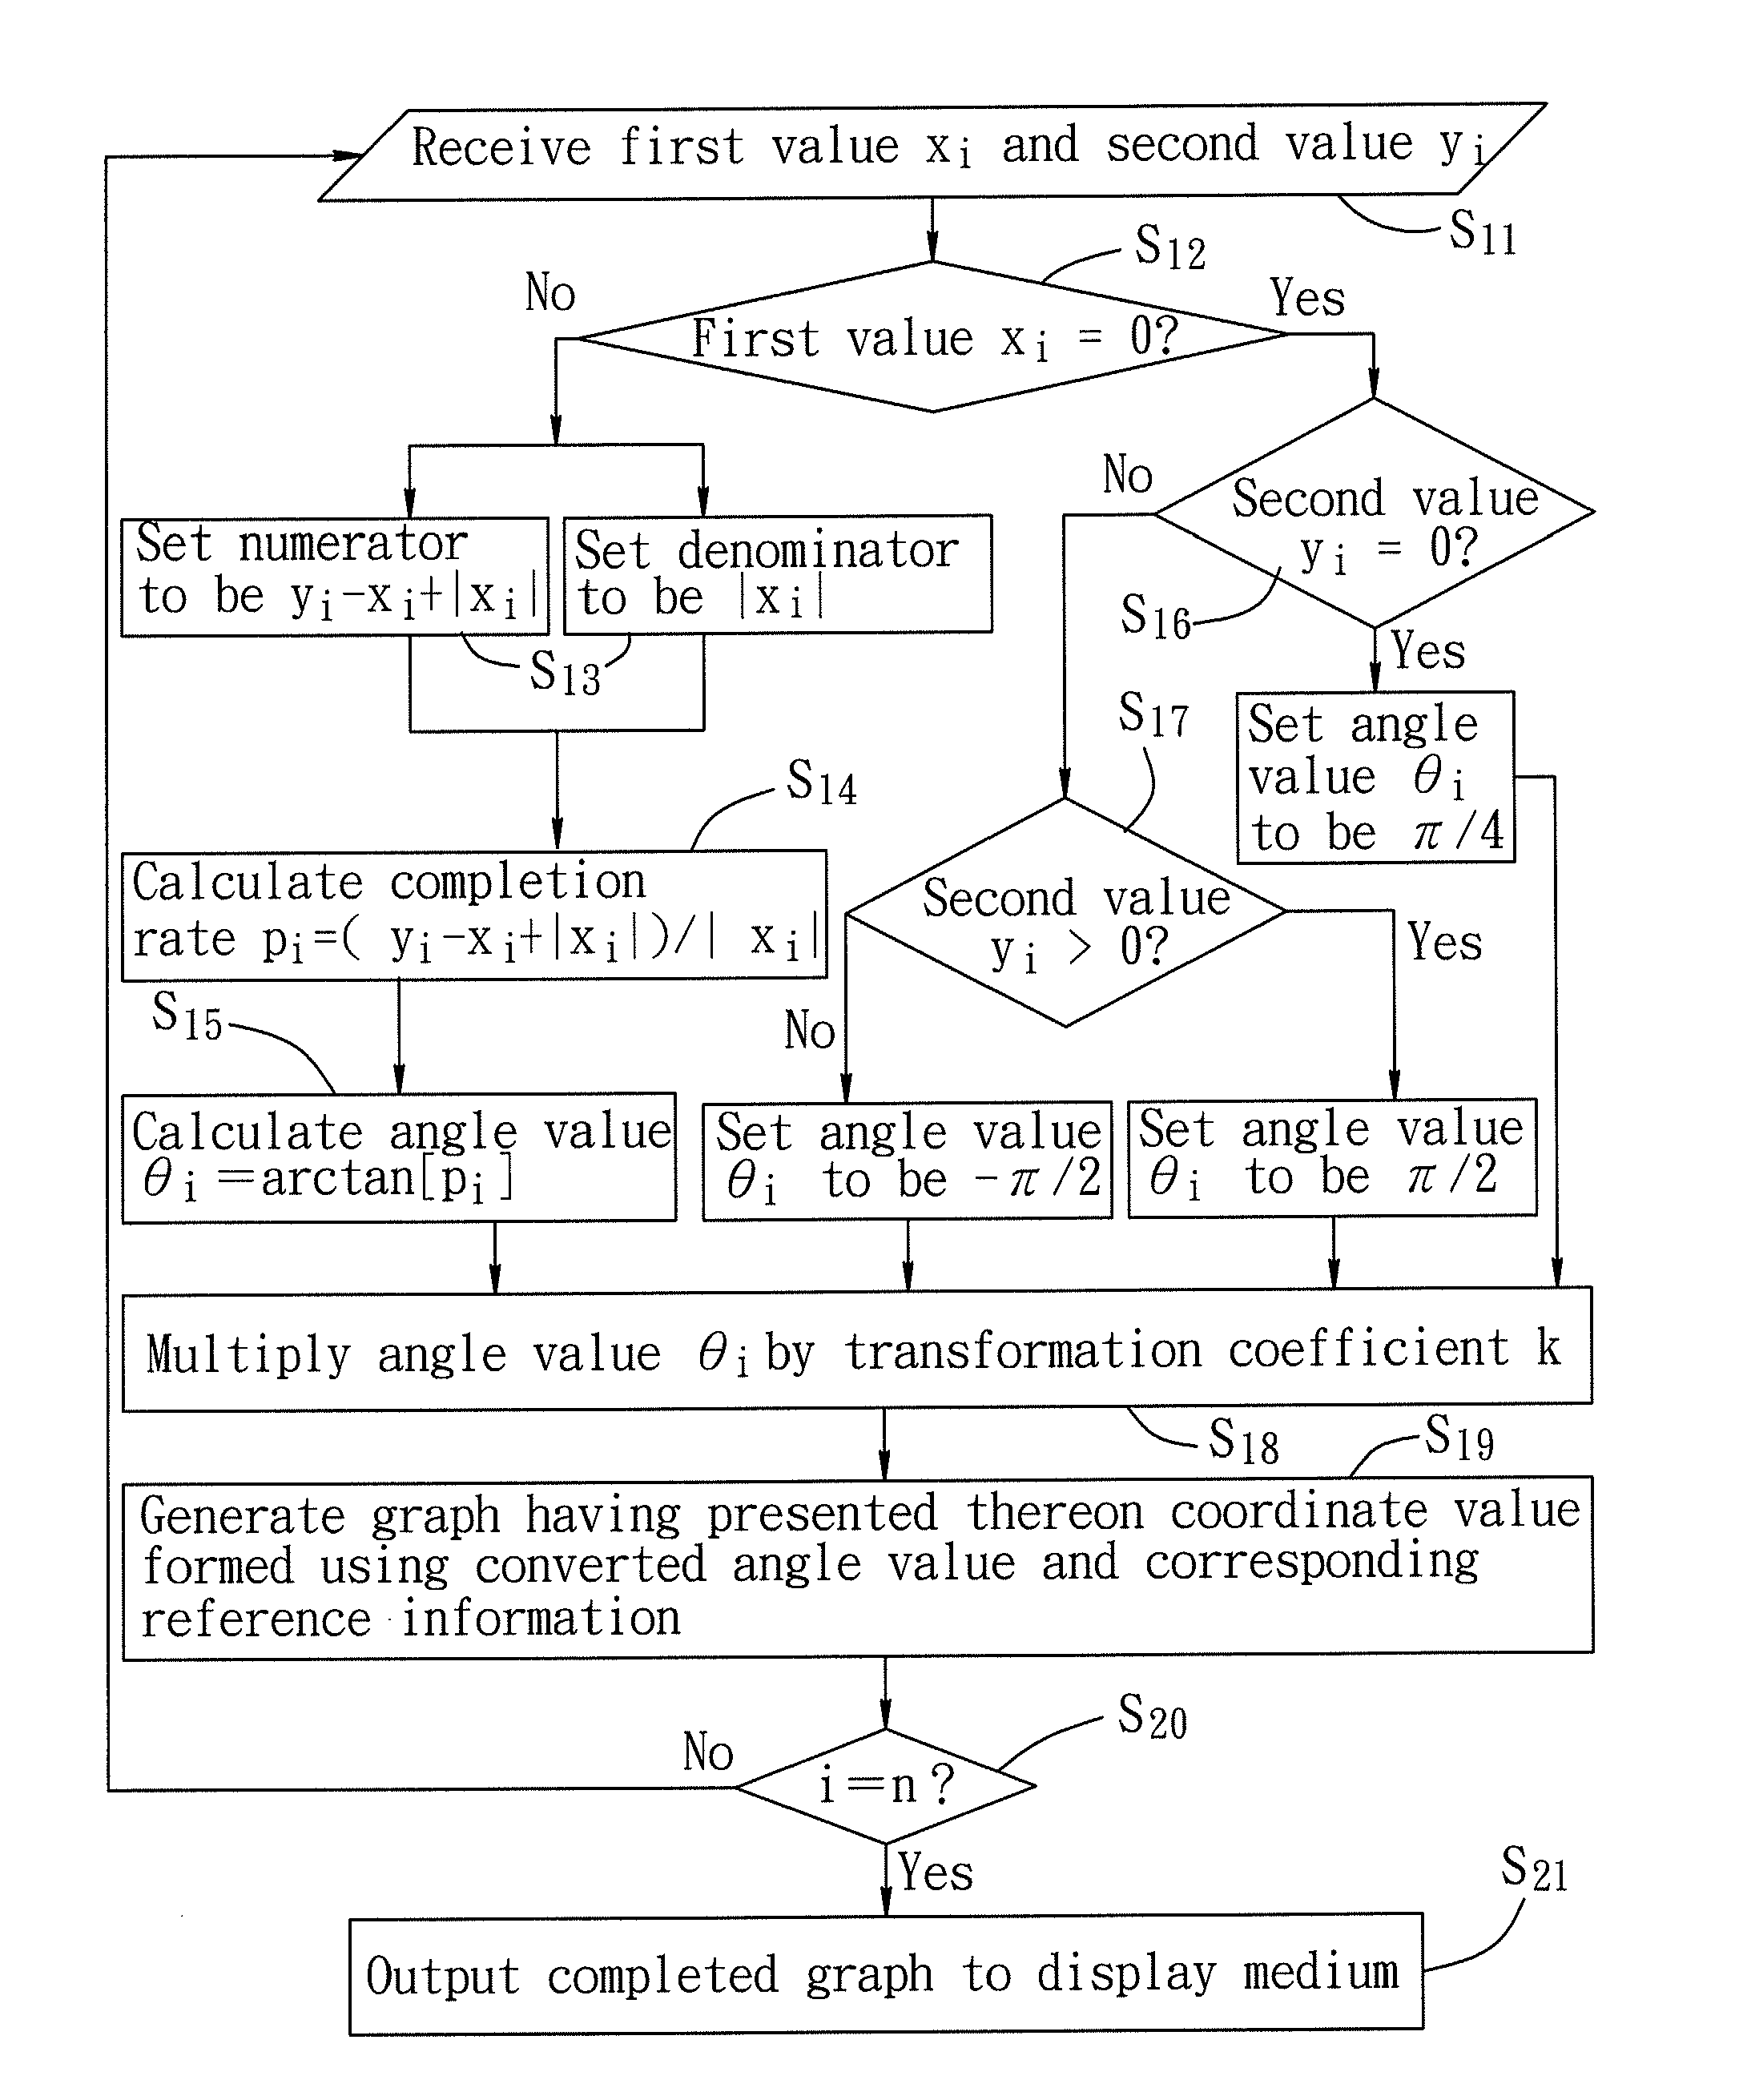
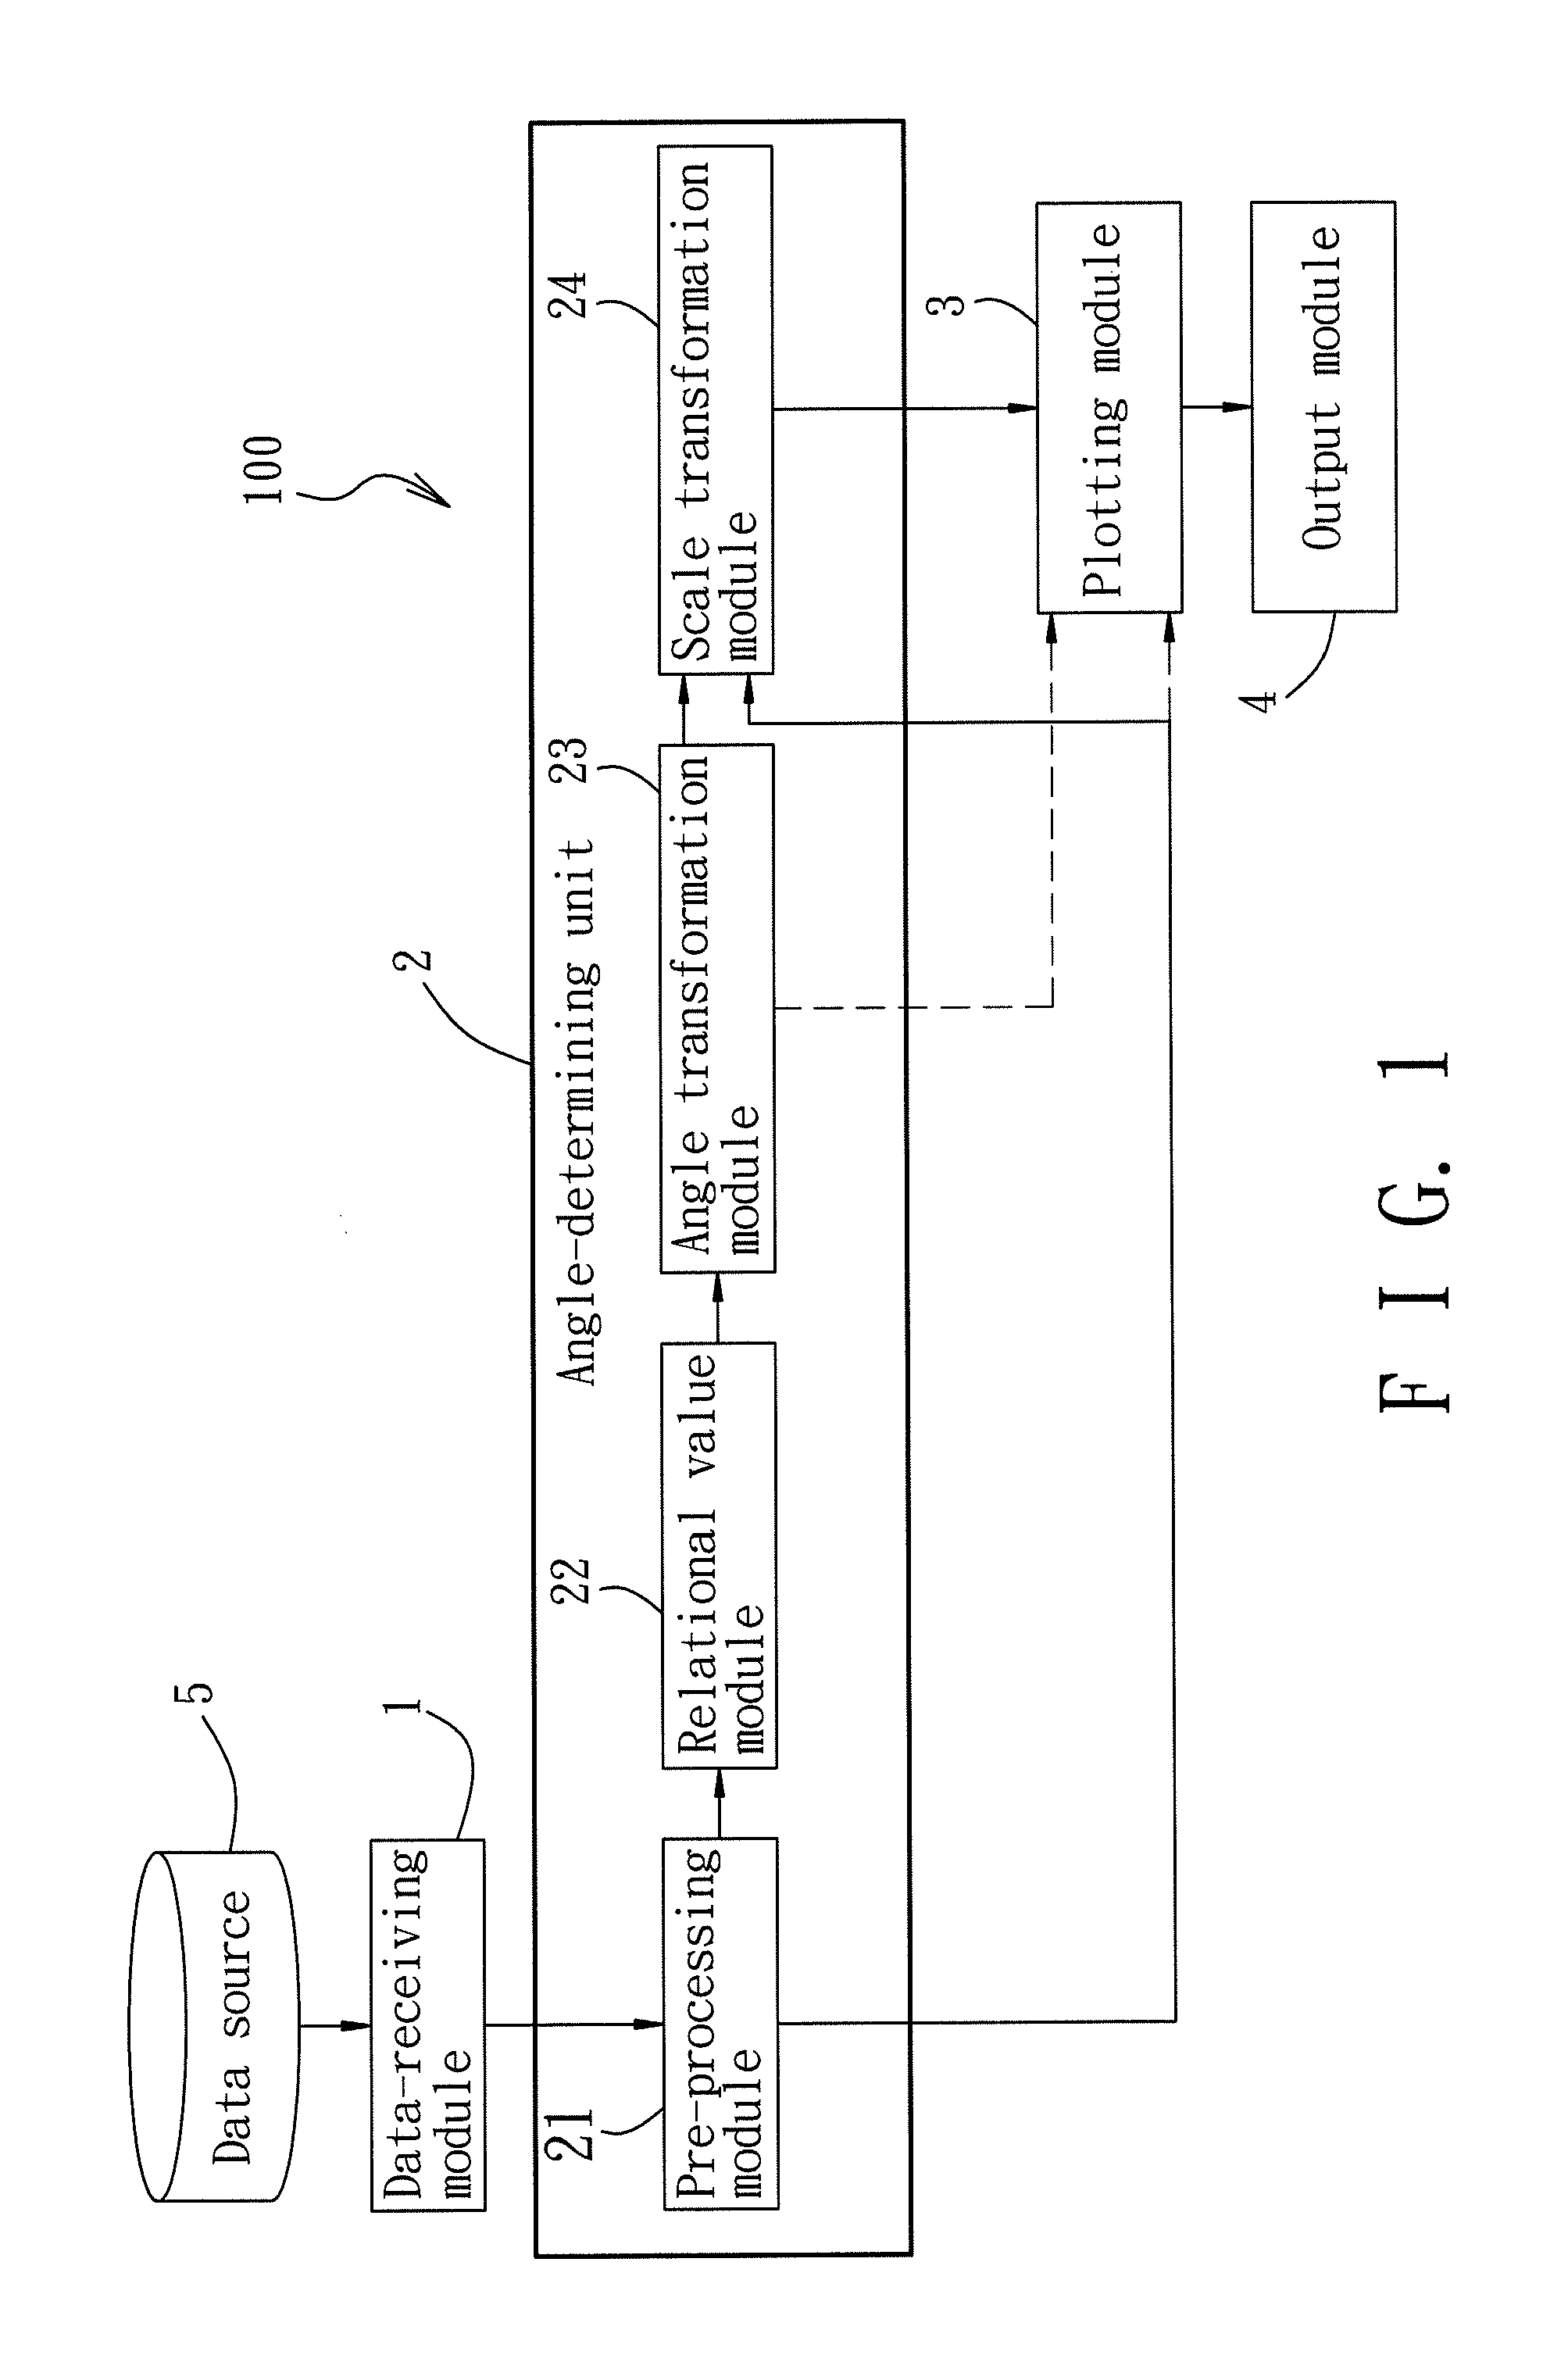
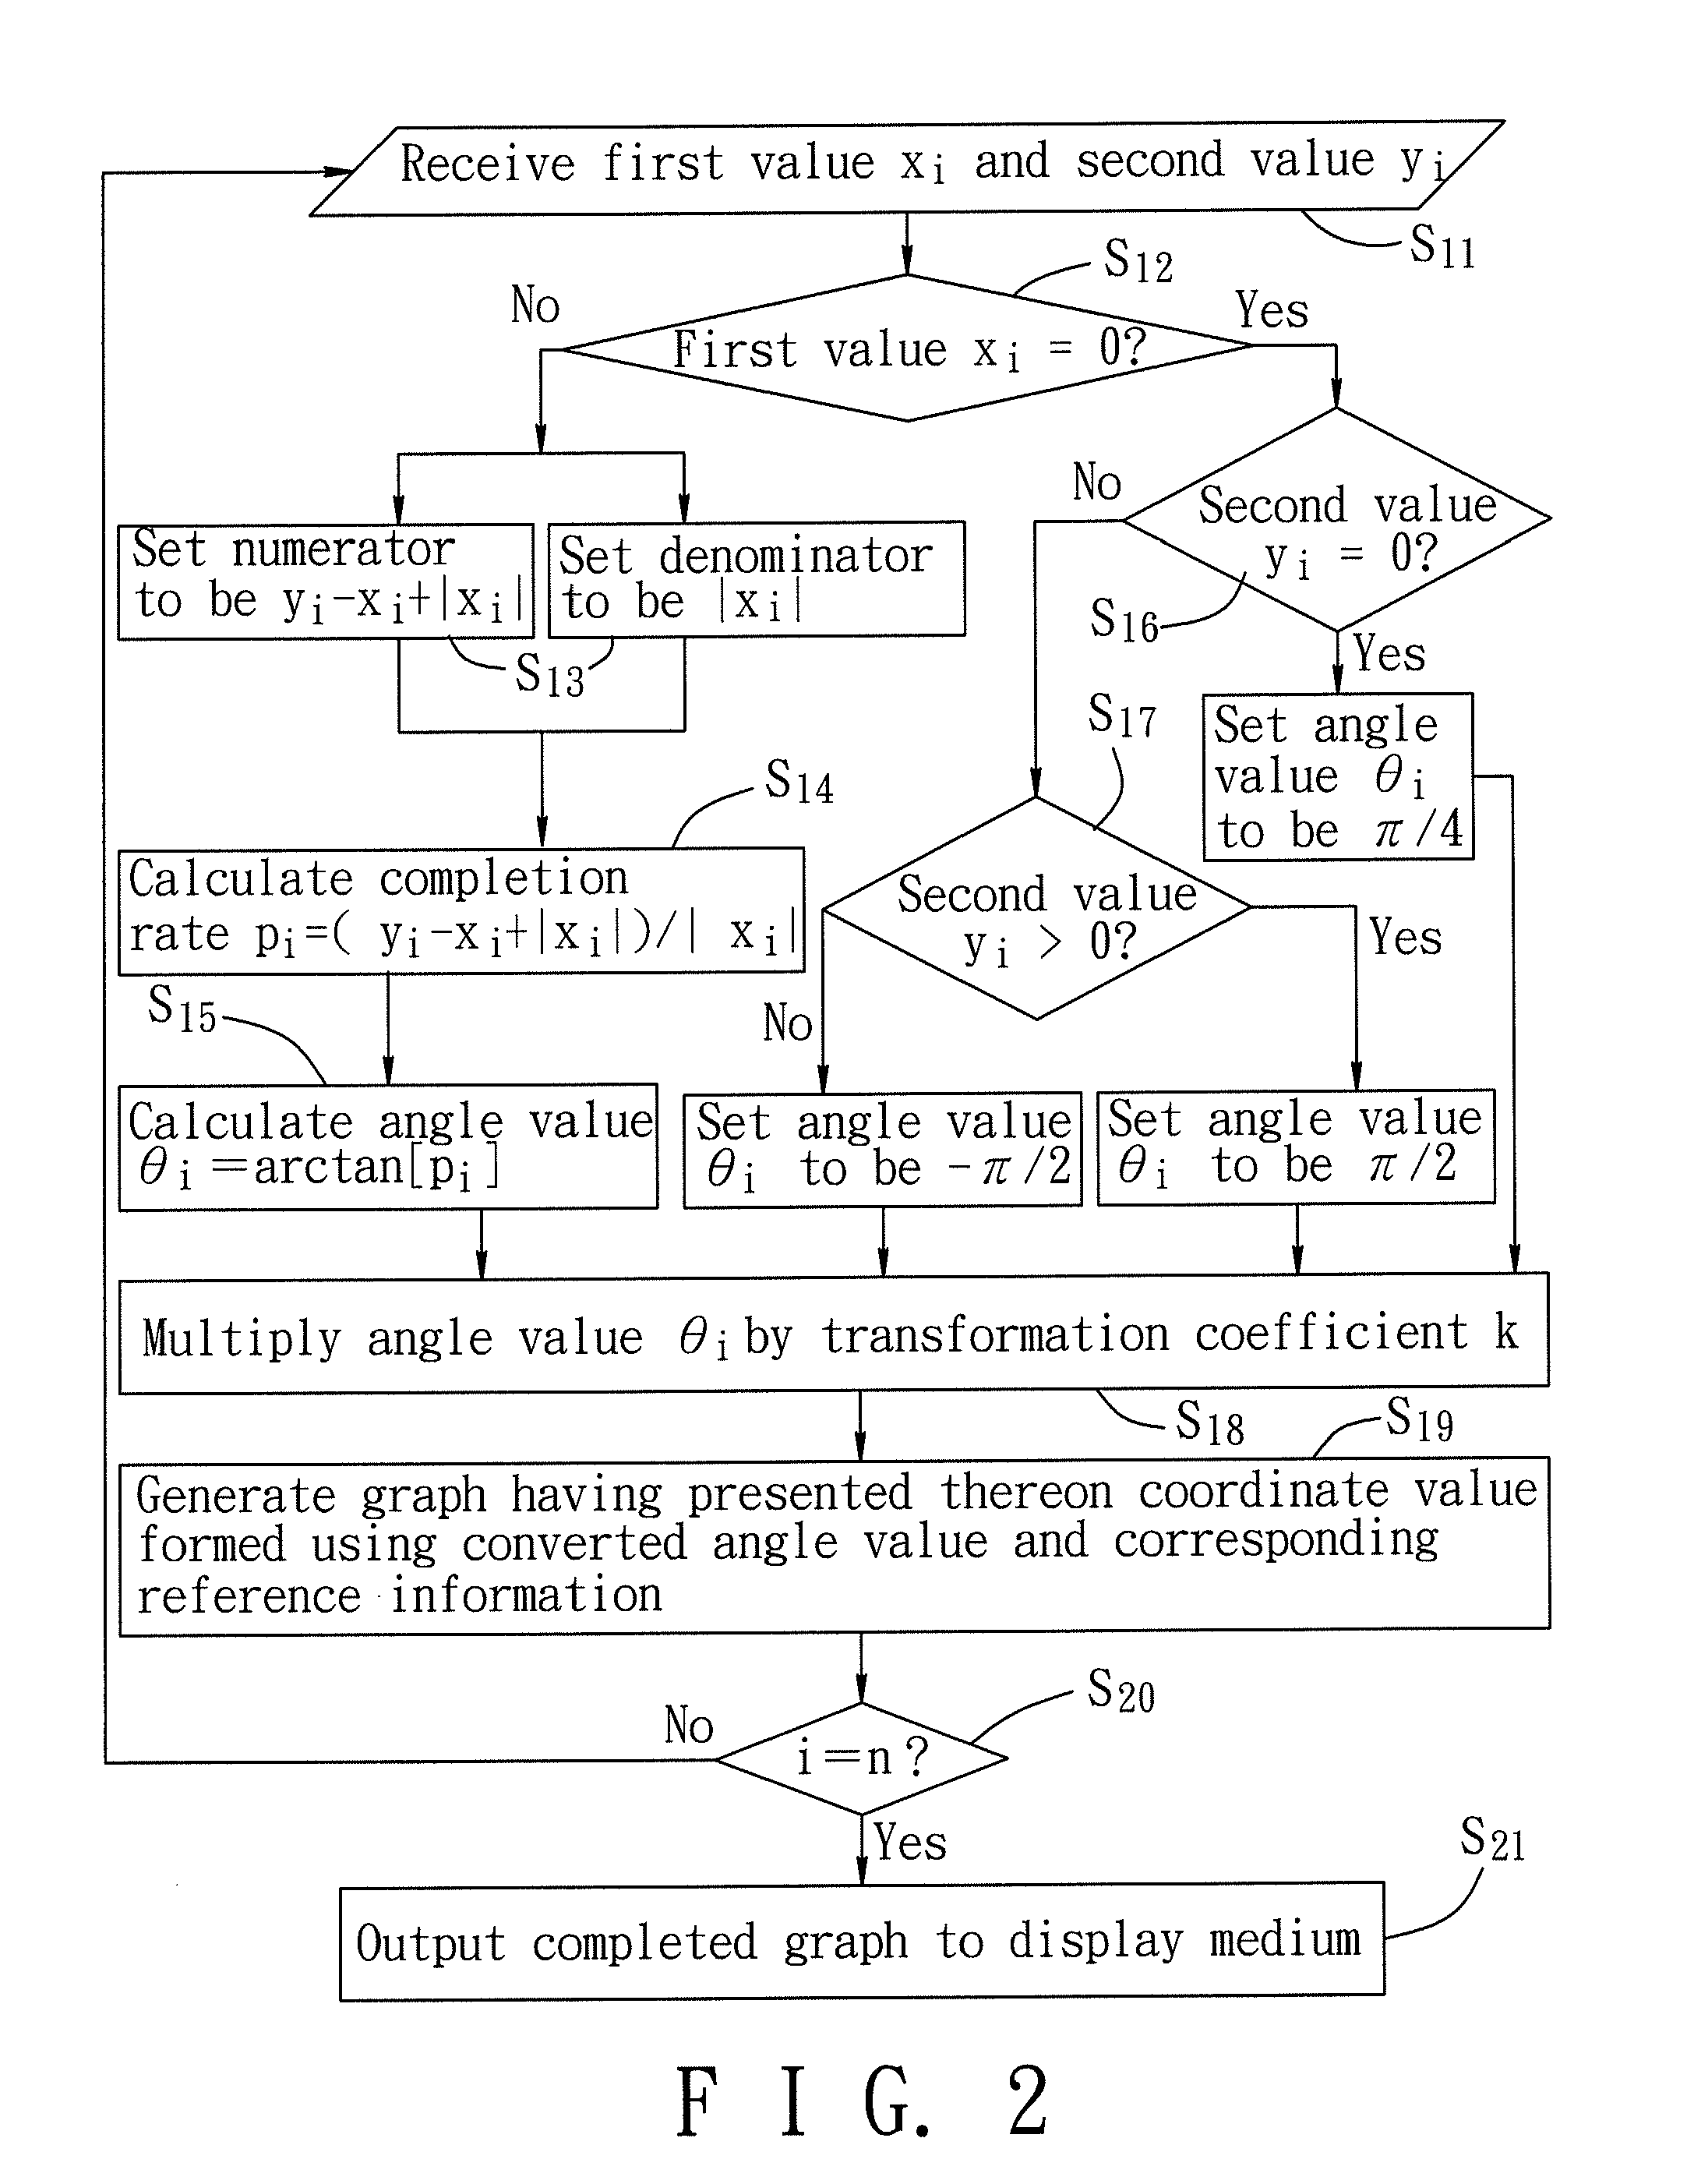
[0027]Referring to FIG. 1, a graphing apparatus 100 according to a first preferred embodiment of the present invention comprises a data-receiving module for receiving data from a data source 5, an angle-determining unit 2 for determining angle values, a plotting module 3 for generating a graph having coordinate values, and an output module 4 for outputting the graph to a display medium (not shown) for display thereon.

[0028]The data source 5 may be an external storage medium such as an optical disc, a flash memory, etc., a memory in the graphing apparatus 100, or a memory that records data input by a user through an input device, such as a keyboard. The data source 5 records a first data set {x1, x2 . . . xn}, a second data set {y1, y2 . . . yn}, and a corresponding reference information set. In this embodiment, the number of values in the first data set is the same as the number of values in the second data set. If they are not the same, then deletion or other appropriate processing...


PUM


Abstract

A graphing method is implemented by a graphing apparatus and includes: (a) receiving a first value and a second value, and reference information corresponding to the first and second values; (b) determining an angle value using the first value and the second value, step (b) including (b-1) calculating a relational value by determining the quotient of a numerator and a denominator, in which the denominator is a function of the first value and the numerator is a function of at least the second value, and (b-2) obtaining the angle value by inputting the relational value in a predetermined inverse trigonometric function; (c) generating a graph having presented thereon a coordinate value formed using the angle value and the reference information; and (d) outputting the graph to a display medium for display thereon. A computer program product and a graphing apparatus are also disclosed.

Description

BACKGROUND OF THE INVENTION[0001]1. Field of the Invention[0002]The present invention relates to a graphing method for presenting values associated with two data sets, in which processing of zero and negative denominator values is possible, and angle transformation is performed prior to plotting on a graph such that graph compression is not required. The present invention also relates to a graphing apparatus and a computer program product that stores a program for executing the graphing method.[0003]2. Description of the Related Art[0004]It is often desirable to compare two data sets. One way to accomplish this is to calculate ratios in which the denominator is a function of a value from the first data set and the numerator is a function of at least a corresponding value from the second data set. For example, a value of a present period may be divided by a corresponding value of a previous period and the resulting quotient multiplied by 100% to thereby obtain what is referred to her...

Claims


Application Information

Patent Timeline
Patent Type & Authority Patents(United States)
IPC IPC(8): G06T11/20
CPCG06T11/206
Inventor CHUANG, CHANG-SHANCHUANG, HAO-YUAN
Owner CHII YING
Features
  • Generate Ideas
  • Intellectual Property
  • Life Sciences
  • Materials
  • Tech Scout
  • Unparalleled Data Quality
  • Higher Quality Content
  • 60% Fewer Hallucinations
Learn More