
Graphicalization management system and graphicalization management method of financial instruments

A management system and management method technology, applied in finance, data processing applications, instruments, etc., can solve problems such as investment barriers, inability to clearly understand the trend of financial commodities, and users' inability to intuitively and quickly understand the intraday trends of financial commodities

Inactive Publication Date: 2012-12-26
YUANTA FUTURES
View PDF3 Cites 13 Cited by
  • Summary
  • Abstract
  • Description
  • Claims
  • Application Information

AI Technical Summary

Problems solved by technology

It is worth noting that since the above-mentioned line charts are all about the transaction situation within a given period, such as price range and transaction volume, it cannot convey the actual transaction details of investment commodities
When users view these line charts after the fact, it is impossible to clearly understand the changes in the direction of financial instruments
When users view these line charts intraday, due to the lack of obvious prompts and assistance in the above line charts, users cannot intuitively and quickly understand the intraday trends of financial products, which creates obstacles to investment

Method used


Image

  • Graphicalization management system and graphicalization management method of financial instruments
  • Graphicalization management system and graphicalization management method of financial instruments
  • Graphicalization management system and graphicalization management method of financial instruments

Examples


Embodiment Construction

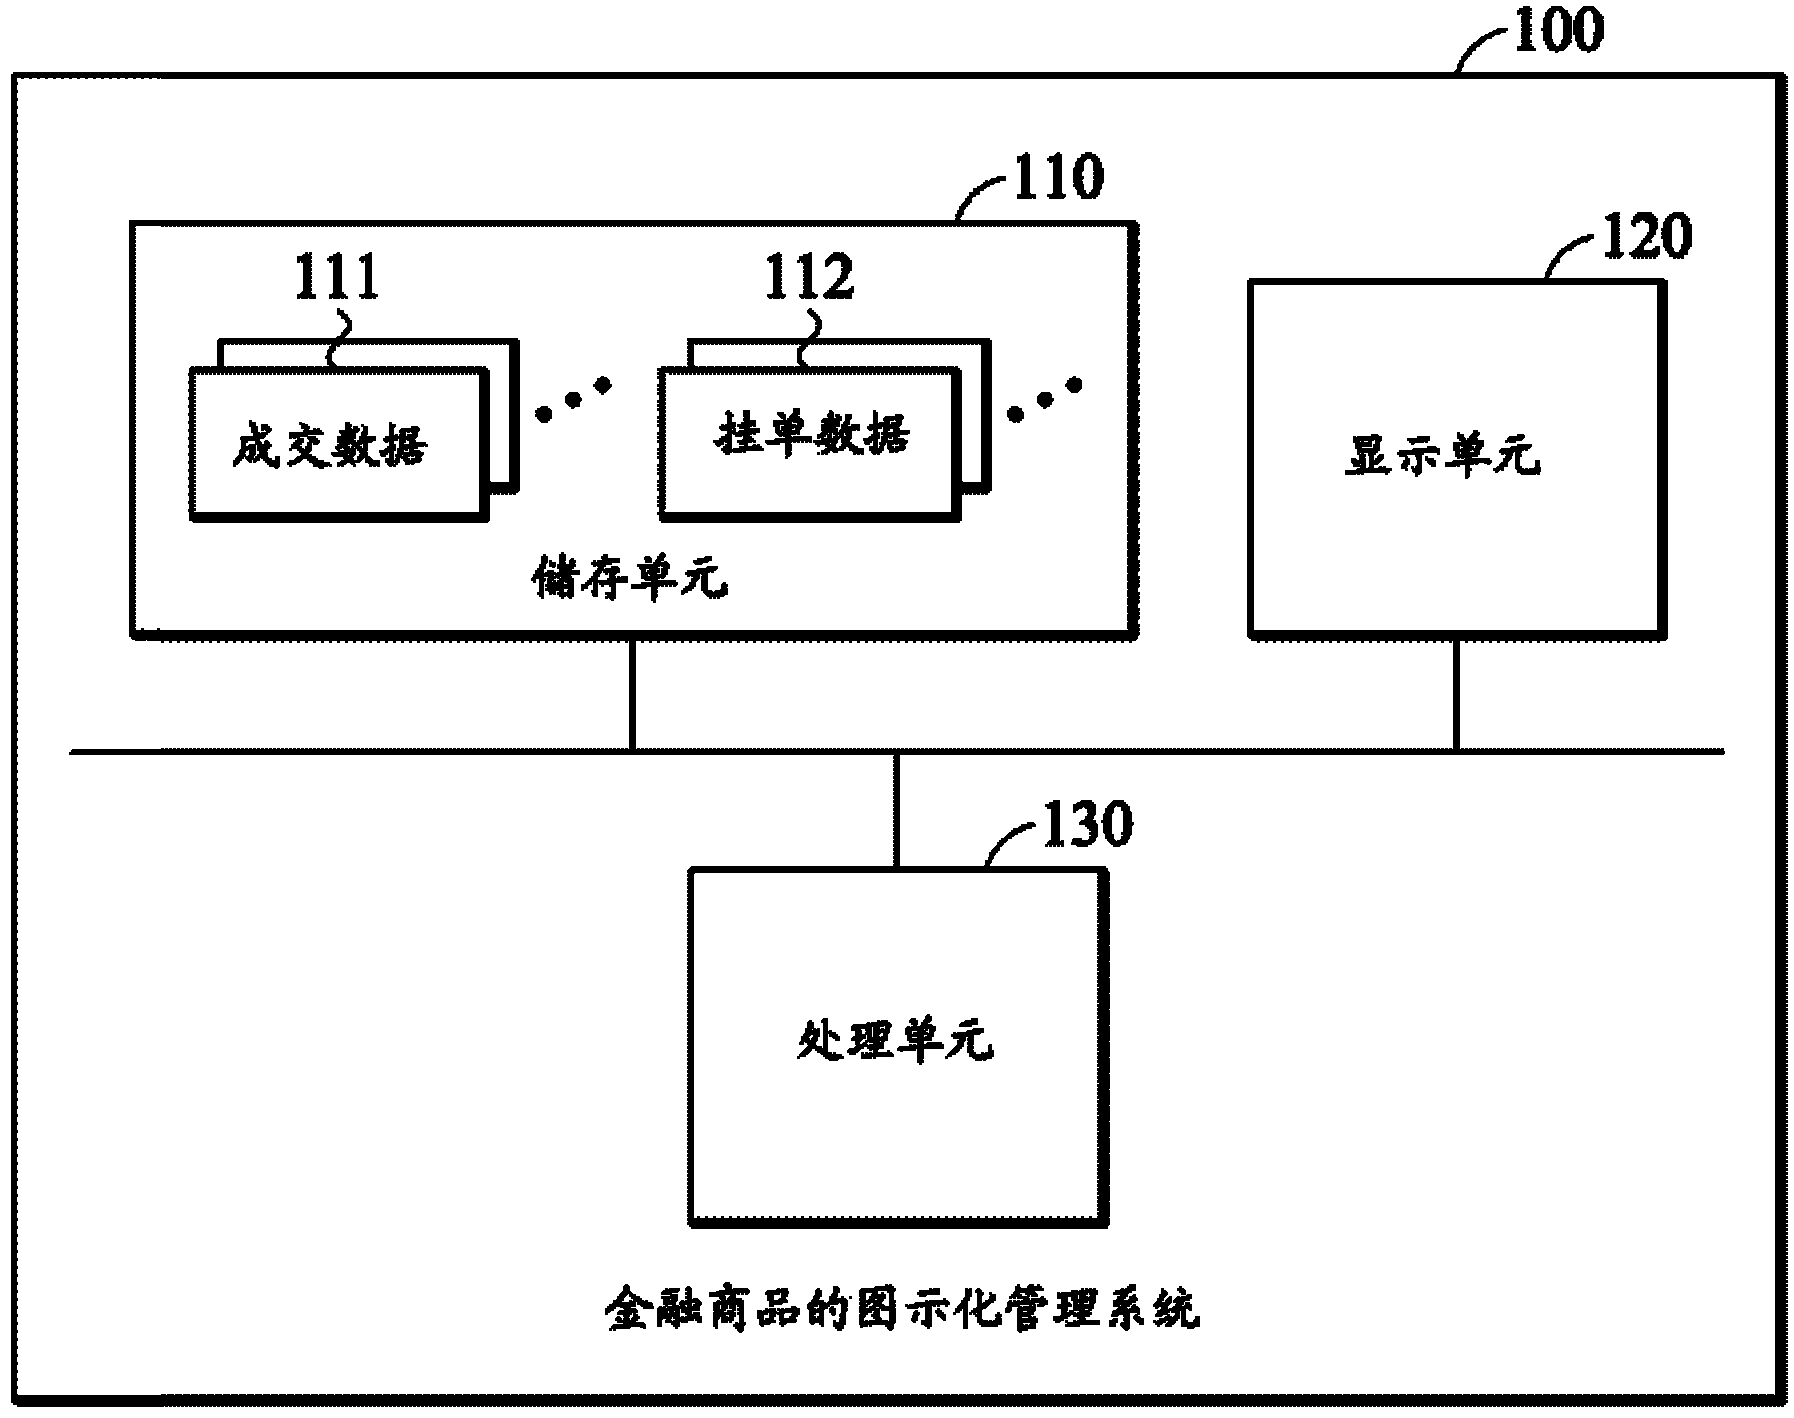
[0037] figure 1 A graphical management system that displays financial commodities according to an embodiment of the present invention. The graphical management system 100 for financial commodities according to the embodiment of the present invention can be applied to an electronic device, such as a computer system, a portable device, and the like.

[0038] The graphical management system 100 for financial commodities includes at least a storage unit 110 , a display unit 120 , and a processing unit 130 . The storage unit 110 may include at least one transaction data 111 corresponding to at least one financial commodity, such as stocks, futures, options, etc., and pending order data 112 corresponding to the at least one financial commodity. It is worth noting that, in some embodiments, the graphical management system 100 for financial commodities may include a receiving unit (not shown) for receiving / downloading transaction data 111 and transaction data 111 and / or pending ord...


PUM


Abstract

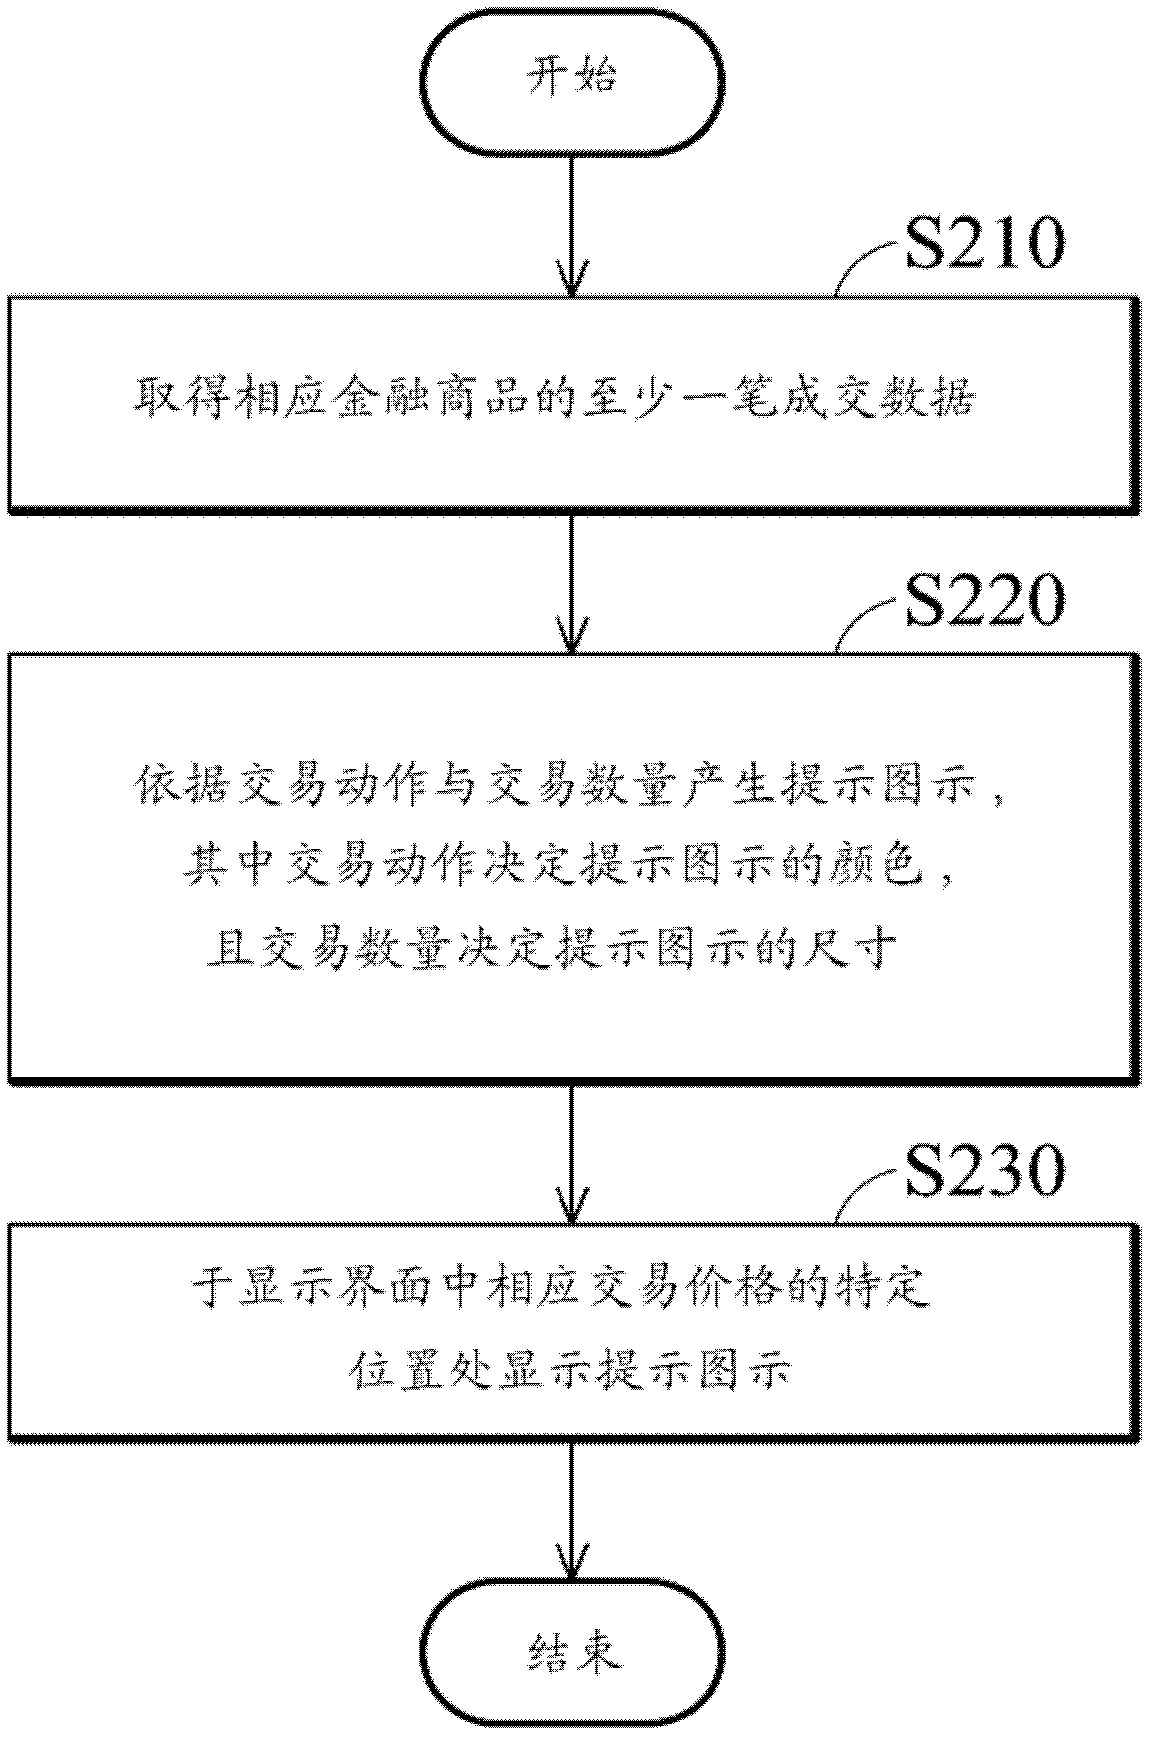
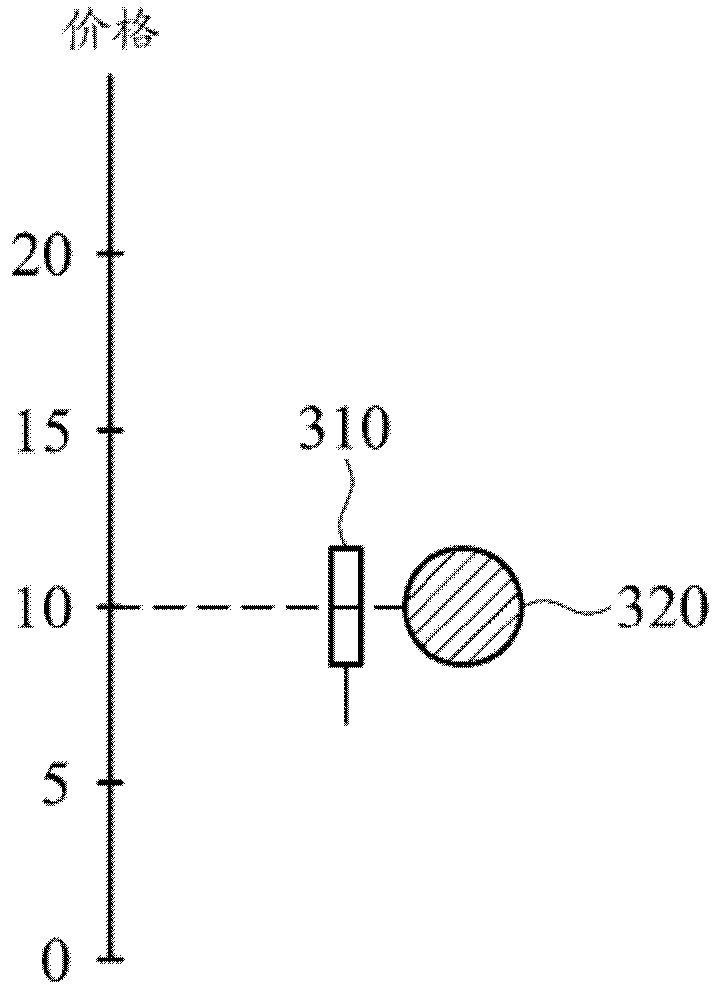
The invention relates to a graphicalization management system and a graphicalization management method of financial instruments. The system comprises a storage unit, a display unit and a processing unit. The storage unit comprises a sum of transaction data corresponding to one financial instrument, wherein the transaction data at least records one transaction action, one transaction price and one transaction quantity. For the transaction data, the processing unit generates one prompting diagram form according to the transaction action and the transaction quantity, the transaction action determines the color of the prompting diagram form, and the transaction quantity determines the size of the prompting diagram form. Then the processing unit displays the prompting diagram form on a designated position of the corresponding transaction price in a display interface through the display unit.

Description

technical field [0001] The present invention relates to a graphical management system and method for financial commodities, and in particular to a system and method that can generate prompt graphics for each transaction data in a display interface to accelerate investment understanding of corresponding financial commodities. Background technique [0002] With the popularization of financial management concepts, various financial management channels and tools, such as funds, bonds, stock markets, futures, etc., have also become one of the most common financial management methods for ordinary investors. In addition, with the trend of financial diversification, in addition to stocks and futures, option commodities have become one of the most emerging investment hedging tools. [0003] As mentioned earlier, there are many types of financial investment commodities in the market, such as stocks, futures and options. In recent years, due to the popularization of computer systems, ...

Claims


Application Information

Patent Timeline
Patent Type & Authority Applications(China)
IPC IPC(8): G06Q40/04
Inventor 张立元
Owner YUANTA FUTURES
Learn More