Predicting gastroenteropancreatic neuroendocrine neoplasms (GEP-NENs)
A technology for GEP-NEN and neuroendocrine tumors, applied in the field of GEP-NEN diagnosis and prognosis, can solve the problems of low sensitivity and/or specificity, inability to detect early disease, inability to treat, etc., and achieve low-cost results
- Summary
- Abstract
- Description
- Claims
- Application Information
AI Technical Summary
Problems solved by technology
Method used
Image

Examples
Embodiment 1
[0361] Sample preparation, RNA extraction, real-time PCR
[0362]Normal and tumor samples were obtained for detection and determination of GEP-NEN biomarker expression levels by real-time PCR. Normal samples included twenty-seven (27) normal small intestinal (SI) mucosa samples (NML), and thirteen (13) normal human enterochromaffin (EC) cell preparations (NML_EC; by fluorescence activated cells of normal mucosa Sorting (FACS) obtained; EC cells with a purity>98% (Modlin IM et al., "The functional characterization of normal and neoplastic human enterochromaffin cells (normal and tumor human enterochromaffin cells)" JClin EndocrinolMetab2006;91(6):2340-8).
[0363] Tumor samples included fifty-three (53) primary SIGEP-NENs and twenty-one (21) corresponding liver metastases collected from a frozen biobank (all tissues were microdissected). The GEP-NEN samples were obtained from enrolled patients following a protocol approved by the Yale University Institutional Review Board. Tu...
Embodiment 2
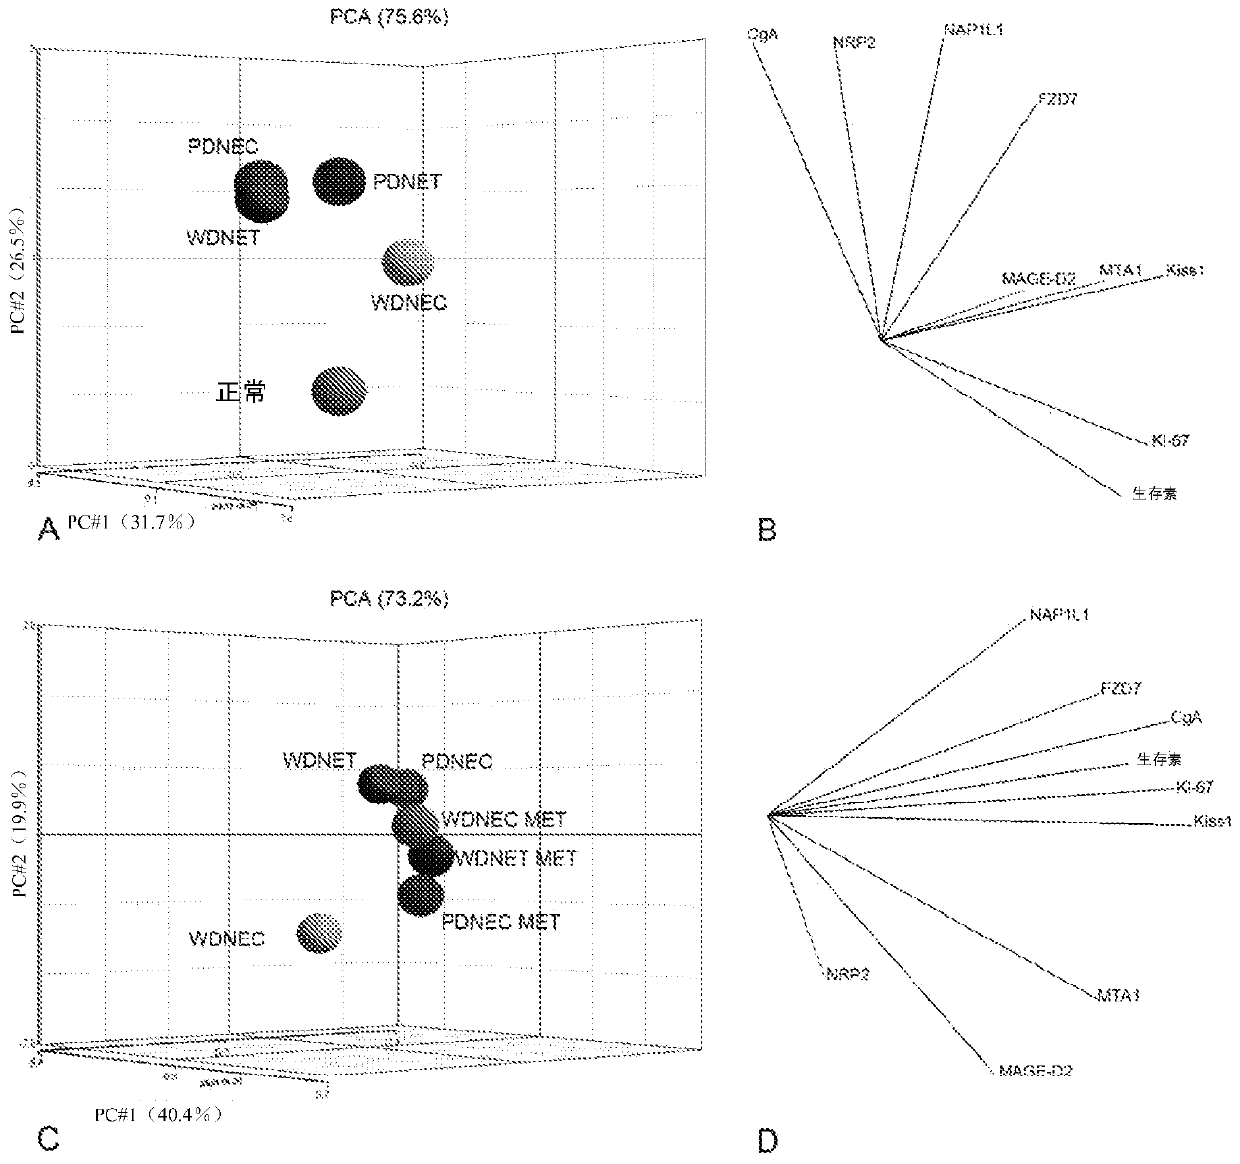
[0397] After natural logarithm (ln) transformation, and enter After GenomicSuite, Principal Component Analysis (PCA) was performed to describe the structure of the high-dimensional expression data. PCA can visualize and compare transcript expression patterns across multiple samples (eg, normal, tumor, GEP-NEN vs. other tumors, GEP-NEN subtypes, primary vs. metastatic / malignant). PCA reduces the dimensionality of the expression data—obtained using 9-biomarker and 21-biomarker panels, respectively—to three unrelated principal components (PCs) that explain the most variation (JolliffeIT, "Principle Component Analysis) ” Springer, 1986.). PCA plotting is visualized in three-dimensional space for the first (1 st ), the second (2 nd ) and third (3 rd ) principal component assignment.
[0398] For the 9 and 21 genomes, the average expression data for multiple samples were superimposed in this PCA coordinate system. The centroid (center of mass (average expression)) of each sam...
Embodiment 3
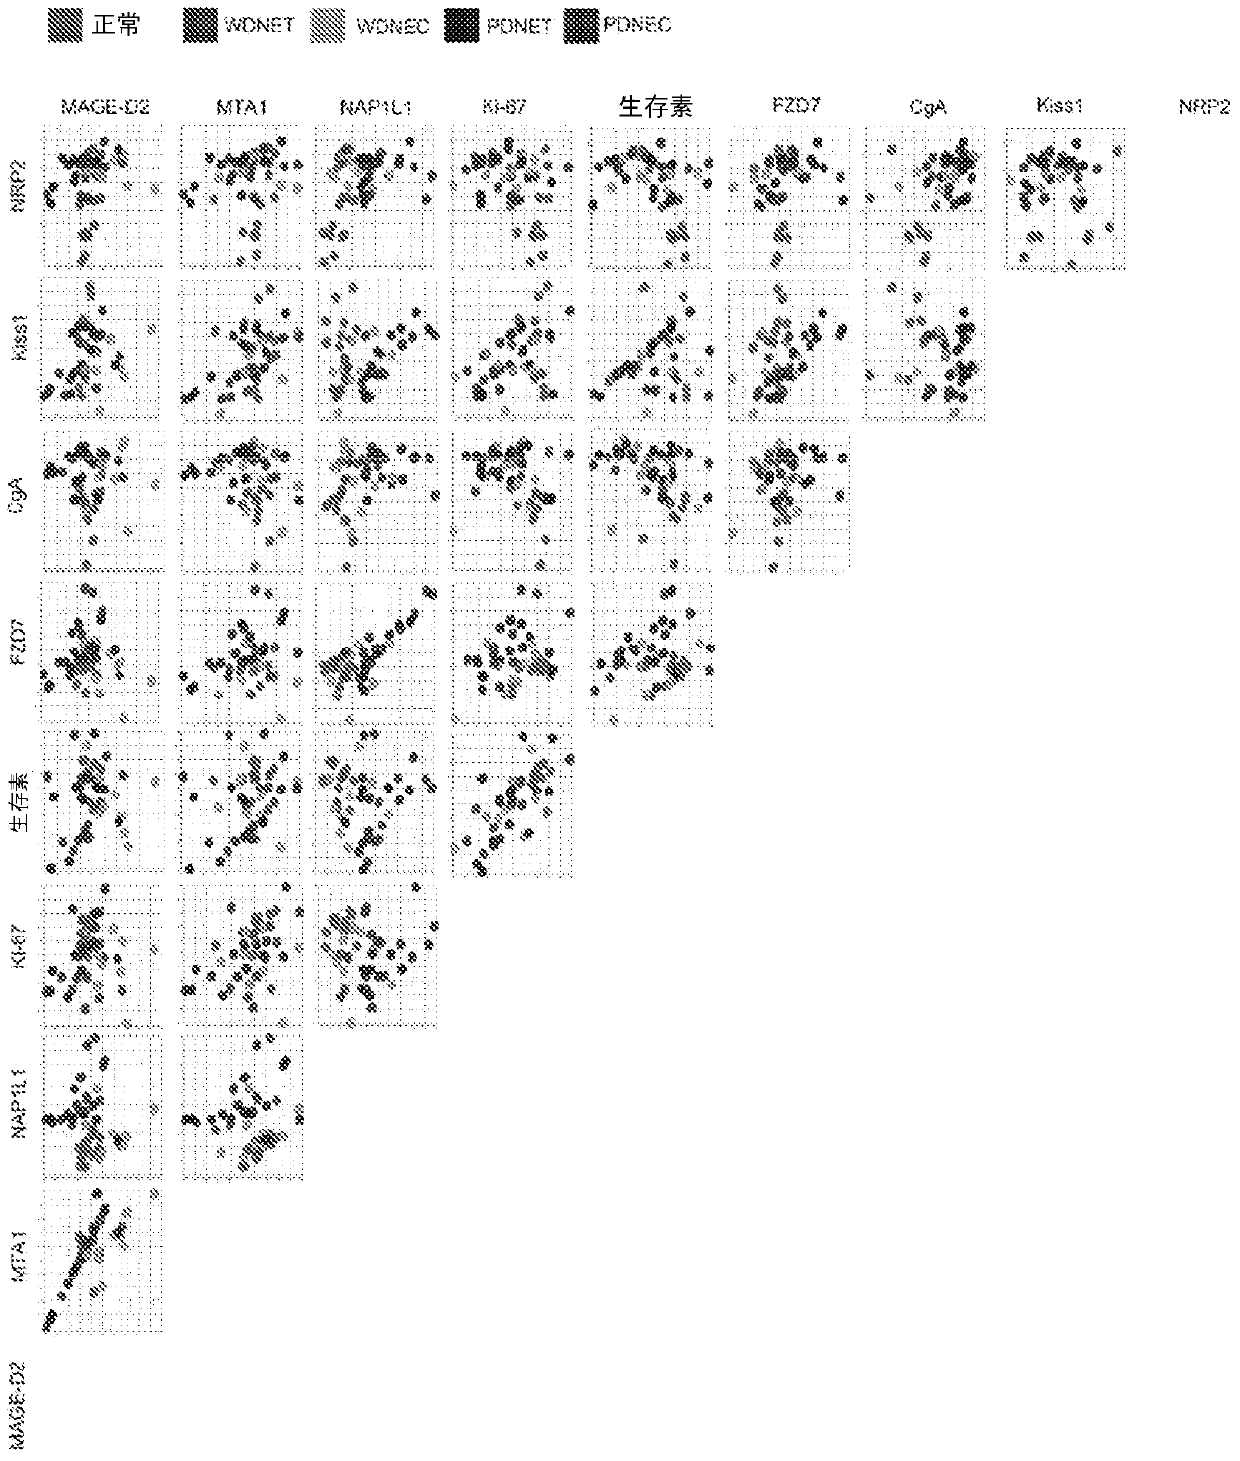
[0409] Statistical analysis and tumor profiling were performed on the transformed expression data obtained from the 9- and 21 -biomarker panels as described above.
[0410] 9- Biomarker panel
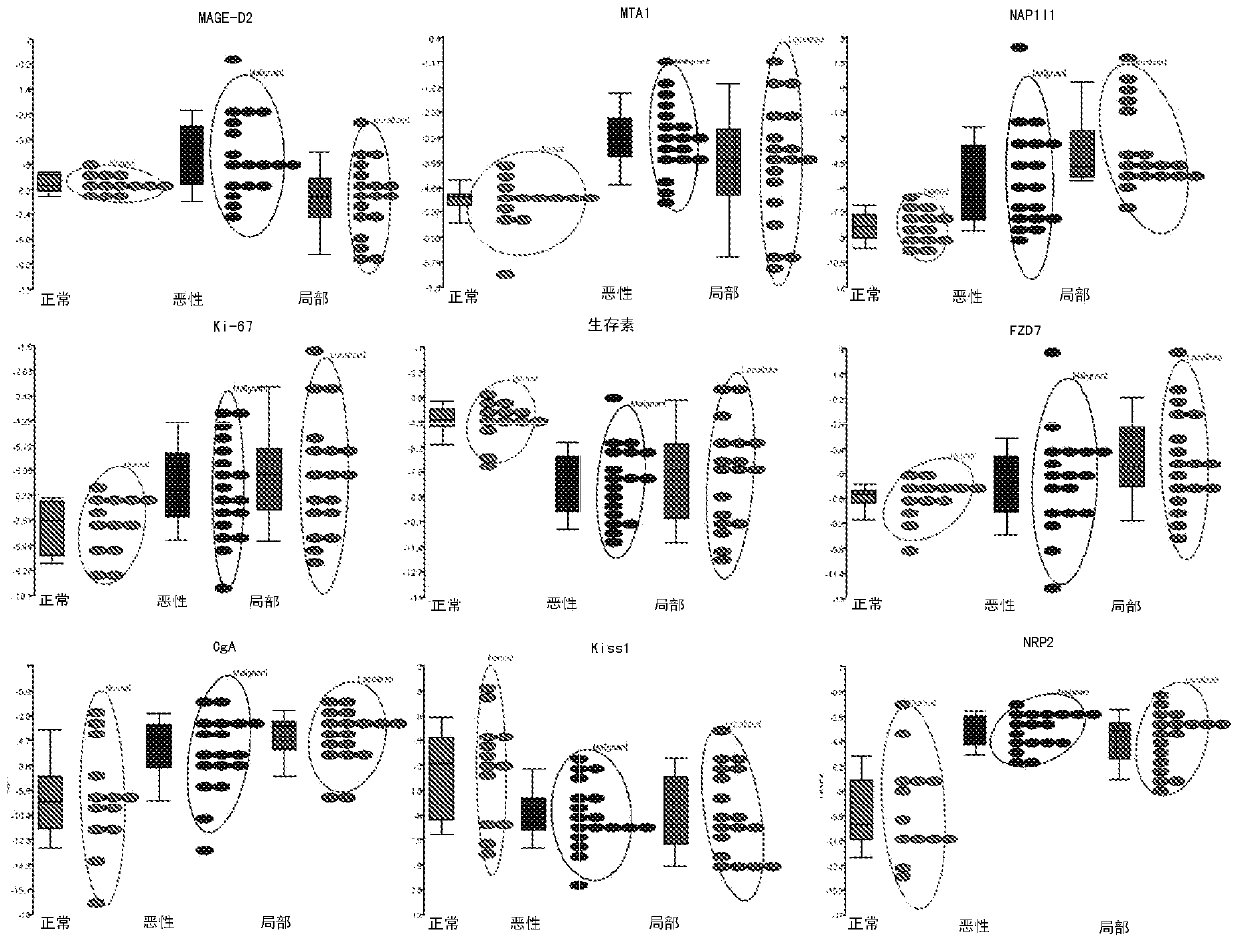
[0411] Mean (M) transcript expression levels and standard deviation (SD) for the 9-biomarker panel were calculated for primary tumor subtypes and normal EC cell preparations. The average normal expression of the biomarkers is: CgA (M 正常 =-9.2,SD=4.2), Ki-67(M 正常 =-4.5, SD 正常 =1.1), Kiss1(M 正常 =-4.0, SD 正常 =3.2), NAP1L1 (M 正常 =-8.3, SD 正常 =1.1), NRP2(M 正常 =-9.3, SD=3.8) and survivin (M 正常 =-6.0, SD 正常 = 1.0), which were significantly different from the mean expression in primary tumors both overall (all tumors) and between individual subtypes. See p-values and fold changes (FC) listed in Table 2 below. Transcript expression level detection in a subset of samples (n=35) was again evaluated. The data are highly correlated (R 2 =0.93, p=0.001), showing that the method is high...
PUM
| Property | Measurement | Unit |
|---|---|---|
| Sensitivity | aaaaa | aaaaa |
| Sensitivity | aaaaa | aaaaa |
| Sensitivity | aaaaa | aaaaa |
Abstract
Description
Claims
Application Information
 - R&D Engineer
- R&D Manager
- IP Professional
- Industry Leading Data Capabilities
- Powerful AI technology
- Patent DNA Extraction
Browse by: Latest US Patents, China's latest patents, Technical Efficacy Thesaurus, Application Domain, Technology Topic.
© 2024 PatSnap. All rights reserved.Legal|Privacy policy|Modern Slavery Act Transparency Statement|Sitemap