

MIR spectral analysis model and method for identifying excessive cadmium content of rice.
A technology for spectral analysis and cadmium in rice is applied in the field of MIR spectral analysis models for identifying excess cadmium content in rice, which can solve the problems of low model identification rate, complex model, slow calculation speed, etc. high rate effect
- Summary
- Abstract
- Description
- Claims
- Application Information
AI Technical Summary
Problems solved by technology
Method used
Image

Examples
Embodiment 1
[0044] A MIR spectral analysis model for identifying excessive cadmium content in rice, the MIR spectral analysis model is established by the following method:
[0045] 1. Sample selection and determination of qualified rice: randomly select 120 different rice samples, use graphite furnace atomic absorption method to measure cadmium content in 120 rice samples respectively, and compare the measured cadmium content with "GB-2762-2012 Food According to the requirements of the cadmium content limit in rice in the "Limits of Pollutants in Food", determine whether each rice sample exceeds the standard, and will meet the requirements of the cadmium content limit in rice in the "GB-2762-2012 Limits of Pollutants in Food" standard (that is, cadmium 120 rice samples with qualified cadmium content, 49 rice samples with qualified cadmium content), the judgment value is set to -1, rice with excessive cadmium content exceeding the limit requirements for rice (120 rice samples with excessive...
Embodiment 2
[0063] A method for discriminating whether the cadmium content in rice exceeds the standard using the MIR spectrum analysis model of embodiment 1, specifically comprises the following steps:
[0064] a. Collect the spectral data of the rice to be tested: use the MIR spectrometer as a sampling device to collect the standard spectra of 20 commercially available rice samples to be tested (the rice samples to be tested were purchased in Beishan Town, Changsha County, variety: Xiangwan Xian 12) data.
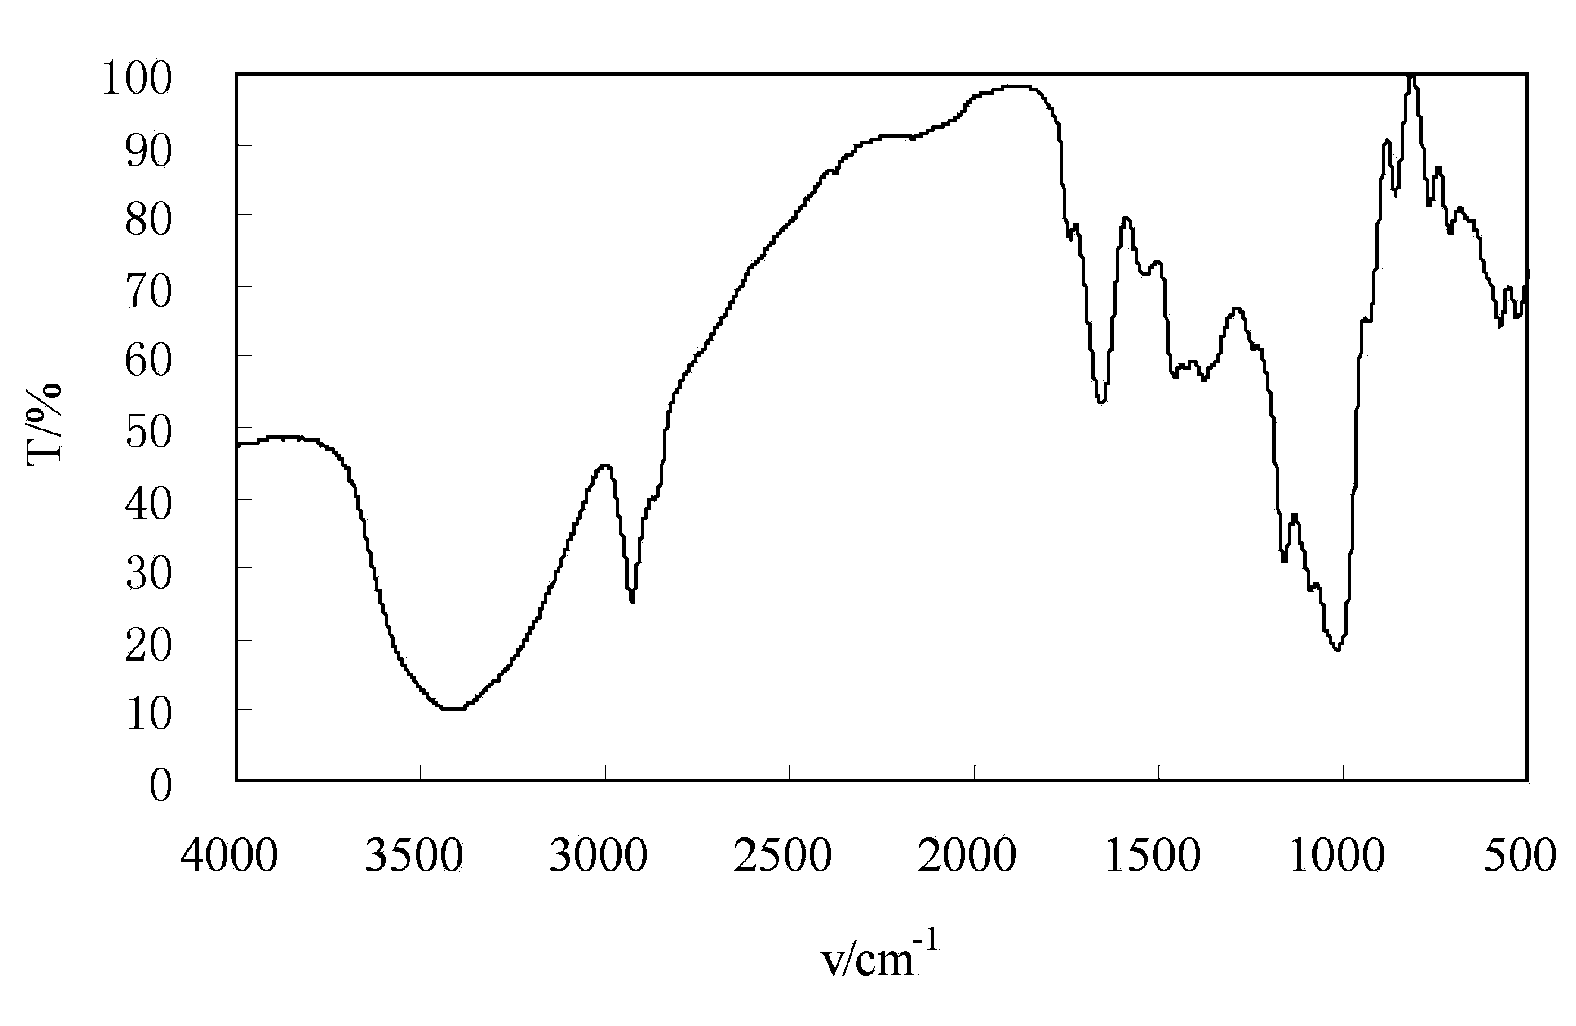
[0065] The steps for the MIR spectrometer to collect the standard spectrum are: the mid-infrared spectrum scanning wavenumber is 4000cm -1 ~500cm -1 , take 2g of the sample and grind it finely in an agate mortar, add an appropriate amount of dried and ground potassium bromide powder, the mass ratio of the sample to potassium bromide is about 1:100, mix and grind thoroughly; the ground mixture Evenly put it between the top mold and the bottom mold of the mold, then put the mold into...
PUM
 Abstract
Description
Claims
Application Information