Method for quantifying immune cells in tumoral tissues and its applications

A technology of immune cells and tumor tissues, applied in measuring devices, instruments, biomaterial analysis, etc., can solve problems such as parameters that do not prove the spatial heterogeneity of tumors

Active Publication Date: 2015-04-22
INST NAT DE LA SANTE & DE LA RECHERCHE MEDICALE (INSERM) +2
View PDF5 Cites 7 Cited by
  • Summary
  • Abstract
  • Description
  • Claims
  • Application Information

AI Technical Summary

Problems solved by technology

However, the study did not demonstrate a specific diagnostic method that yields parameters that would account for the spatial heterogeneity of tumors

Method used


Image

  • Method for quantifying immune cells in tumoral tissues and its applications
  • Method for quantifying immune cells in tumoral tissues and its applications
  • Method for quantifying immune cells in tumoral tissues and its applications

Examples


Embodiment 1

[0168] Example 1: Preparation of stained slides of tumor tissue

[0169] Two tissue paraffin sections of selected 4 micron tumor masses were prepared and stored in deionized water on microscope slides (Superfrost-plus slides) for immunohistochemistry. Tissue paraffin sections were dried at room temperature and incubated overnight in an oven at 56°C-58°C.

[0170] Immunostaining was performed with IVD certified antibodies against CD3 and CD8 (CONFIRM CD3 (2GV6, Ventana) and CD8 (C8 / 144B; Dako)). The associated protocol contains the critical steps of blocking, epitope retrieval, and detection. Modified Mayer's hematoxylin (Hematoxillin II, Ventana) intended for staining nuclei on slides was applied for optimal detection of stained cells with dedicated software. The solution used with Benchmark XT automation (Roche-Ventana) is:

[0171]

[0172] CC1 is a tris-based buffer with a slightly basic pH. The primary antibody diluent against CD8 was K004 (Clinisciences).

[0173]...

Embodiment 2

[0175] Example 2: Analysis of stained slides by software processing

[0176] .The pathologist has uploaded the digital images of each immunohistochemistry for CD3 and CD8 and started the analysis with the dedicated image analysis software (Definiens Developer XD).

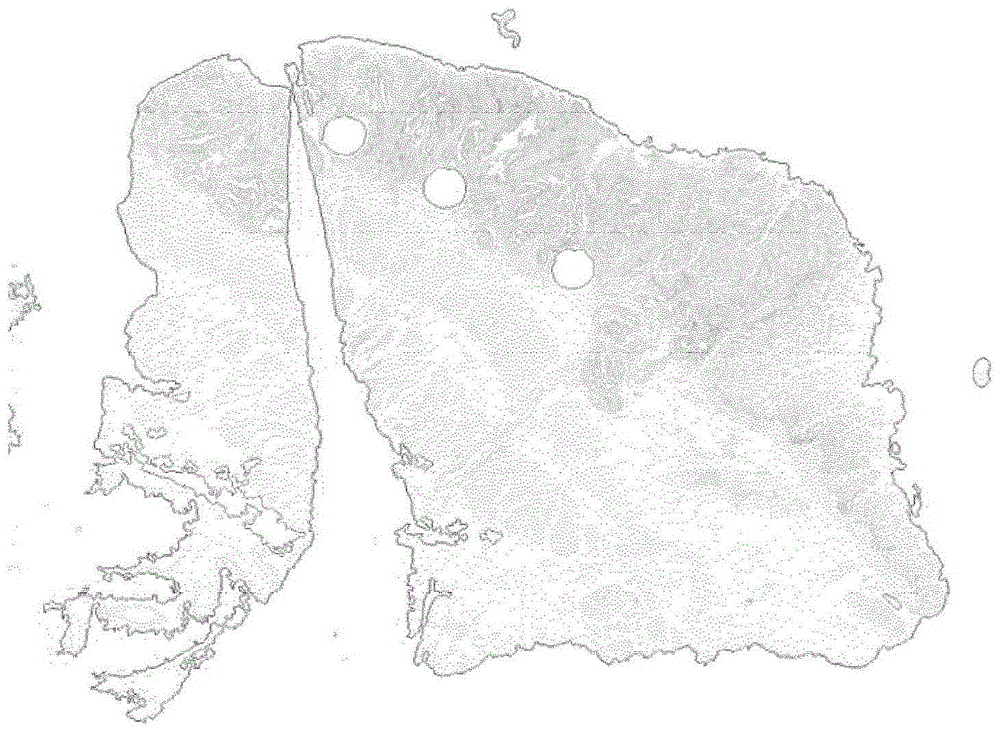
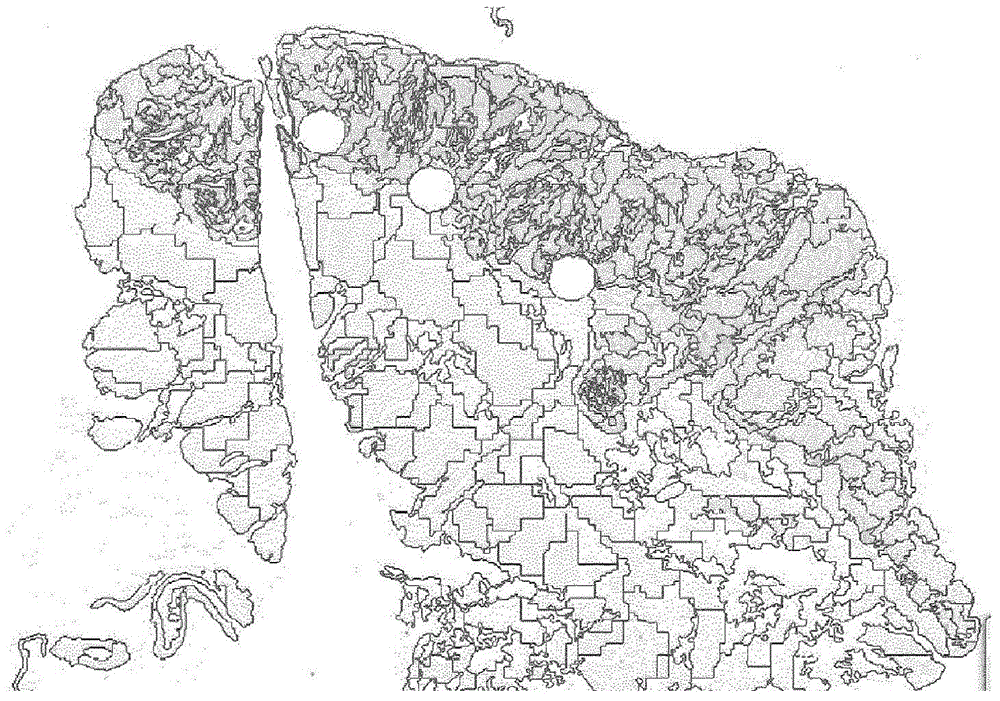
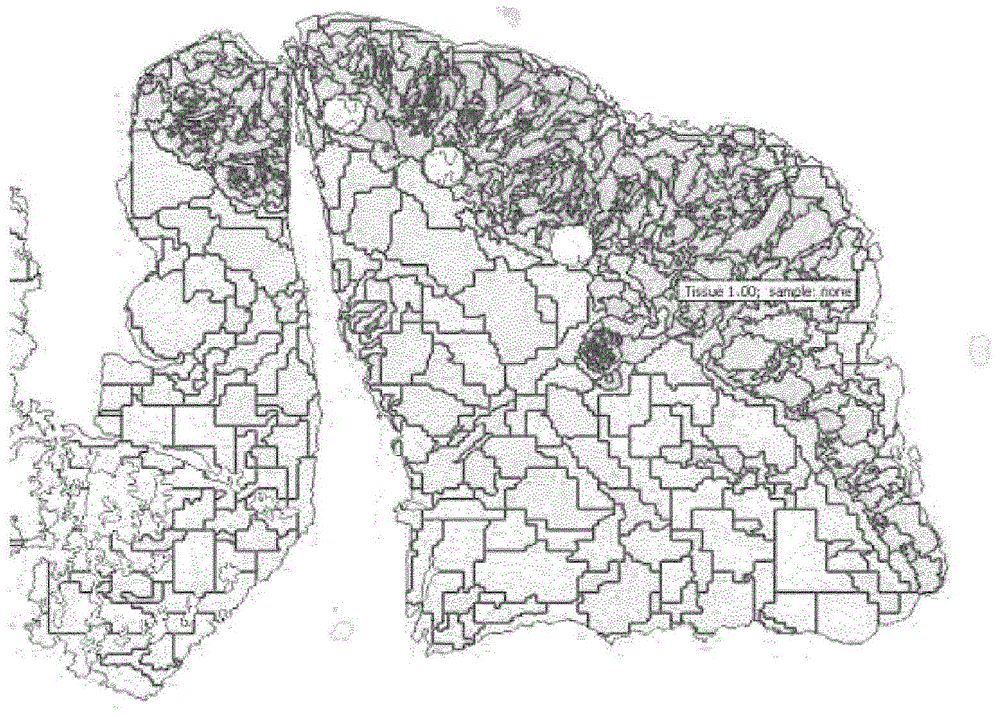
[0177] .The semi-automatic procedure consists of steps for:

[0178] - automatic detection of tissues,

[0179] - Automatic segmentation of tissue into units,

[0180] - manual removal of artificial parts (folds, tears, air bubbles, ...),

[0181] - manual selection of tumor areas by the pathologist using a brush as a digital tool,

[0182] - automatic detection of intrusive edges,

[0183] - automatic detection of stained cells in each cell of the tumor,

[0184] - Analysis of the distribution, mean and median of the staining intensity of the positive cells detected by the software in the graph to verify the immunostaining and quantification of the stained cells; this analysis is carried out for each cell of ...

Embodiment 3

[0202] Example 3: Example of Calculation of Optimal Threshold Values ​​from P-Values ​​(Log-Rank Test) of Associated Disease-Free Survival Rates

[0203] Calculate p-value for disease-free survival (log-rank test)

[0204] For 20 to 2000 CD3+ cells / mm 2 For each value of , the number of patients with a density of CD3+ cells in the tumor (CT region) (dots on the bottom curve) less than the value was determined (thus providing the patient group).

[0205] Calculation of 20 to 2000 CD3+ cells / mm in tumors (dots and corresponding curves) comparing patient groups 2 The p-value of the log-rank test for each threshold of .

[0206] result in Figure 15 available in .

[0207] X-axis represents cells / mm 2 Cell densities are indicated, and the Y-axis indicates log-rank p-values ​​(dots and corresponding curves at the bottom of the graph). Hazard ratios (square points and corresponding curves) and iAUC concordance index (thin curves) are also represented.

[0208] Patients were c...


PUM


Abstract

A method for assessment of a number or density of immune cells in tumoral tissues comprising the steps consisting in: a. providing one or more immunostained slices of tissue section obtained by an automated slide-staining system by using antibodies binding specifically to antigens (markers) expressed by immune cells. b. proceeding to digitalisation of the slides of step a. by high resolution scan capture, whereby a high definition (4.6 mum / pixel or better) digital picture of the slide to be analysed is obtained, c. detecting the slice of tissue section on the digital picture d. analyzing the slice of tissue section for defining (i) the tumour (CT) and (ii) the invasive margin of the tumour (IM), e. providing a size reference grid with uniformly distributed units having a same surface, said grid being adapted to the size of the tumour to be analyzed, e1. checking the quality of immunostaining, f. detecting and quantifying stained cells of each unit whereby the number or the density of immune cells stained of each unit is assessed.

Description

field of invention [0001] The present invention relates to methods and applications for quantifying immune cells in tumor tissues. Background technique [0002] EP-A-EP1943520 and WO2007045996 describe in vitro methods for prognosing the progression and / or survival of cancer in a patient, and / or predicting the response to treatment (chemotherapy, radiotherapy, biotherapy, immunotherapy) comprising the following step: [0003] a) quantifying at least one biomarker indicative of the state of the patient's local adaptive immune response in a tumor tissue sample from the patient; and [0004] b) comparing the value of said at least one biomarker obtained in step a) with a predetermined reference value for the same biomarker; said predetermined reference value with a specific prognosis or treatment for the progression or survival of said cancer in said patient Prediction of response (such as chemotherapy, radiotherapy, biological therapy, immunotherapy) is correlated to anticip...

Claims


Application Information

Patent Timeline
Patent Type & Authority Applications(China)
IPC IPC(8): G01N33/50G01N33/574
CPCG01N33/5047G01N33/574G01N2800/52G01N33/58G01N33/57492
Inventor J·加隆F·帕热斯B·米莱克尼克
Owner INST NAT DE LA SANTE & DE LA RECHERCHE MEDICALE (INSERM)
Why Eureka
Try Eureka