Interactive visualization based multi-dimension data analyzing method and system

A multi-dimensional data and analysis method technology, applied in structured data retrieval, electronic digital data processing, geographic information database, etc., can solve the problem of inability to effectively display the relationship between multi-dimensional attribute feature distribution patterns and other issues, and achieve dynamic and effective multi-dimensional attribute interaction. Linkage and analysis, the effect of interactive linkage and analysis of multi-dimensional attributes

Active Publication Date: 2017-06-20
深圳市位和科技有限责任公司
View PDF1 Cites 17 Cited by
  • Summary
  • Abstract
  • Description
  • Claims
  • Application Information

AI Technical Summary

Problems solved by technology

[0005] The present invention provides a method and system for analyzing multi-dimensional data based on interactive visualization. Its main purpose is to solve the problem that the existing multi-dimensional data exploration and analysis cannot realize dynamic and effective

Method used


Image

  • Interactive visualization based multi-dimension data analyzing method and system
  • Interactive visualization based multi-dimension data analyzing method and system
  • Interactive visualization based multi-dimension data analyzing method and system

Examples


Embodiment approach

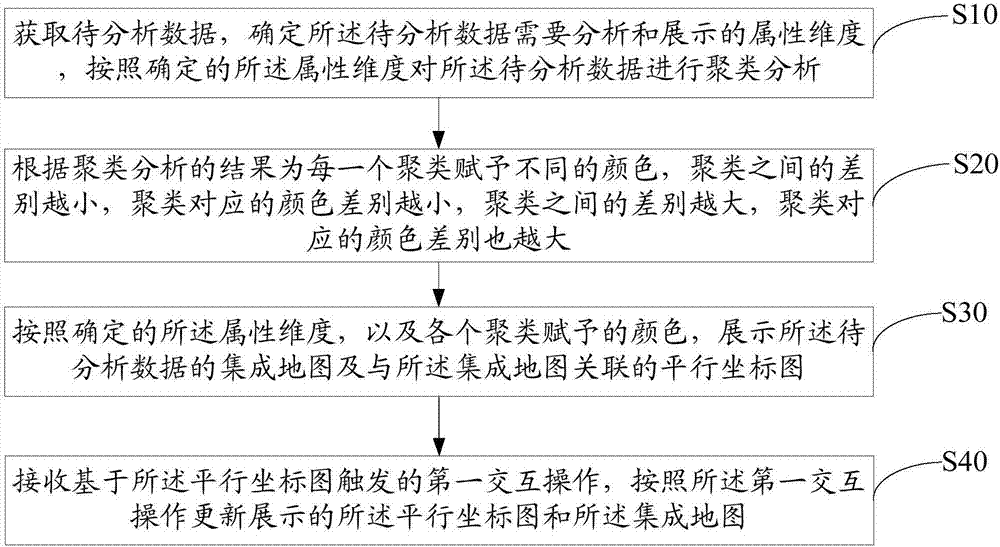
[0074] Further, as an implementation mode, the method also includes the steps of:

[0075] When receiving the request for clustering color display, the two-dimensional color matrix of the data to be analyzed is displayed based on the cluster analysis result and the color assigned to each cluster.

[0076] Specifically, refer to Figure 7 As shown, it is a schematic diagram of the displayed two-dimensional color matrix. The two-dimensional color matrix is ​​another clustering of the clustering results, and the results of the clustering are displayed on the two-dimensional matrix to show the relationship between the clusters. difference. Each circular color block in the illustration represents a cluster, that is, each cluster is displayed as a circle, and the size of the circle represents the number of each cluster. The difference between clusters and clusters is expressed by the color of the clusters and the distance between the circles representing each cluster. The greater...


PUM


Abstract

The invention discloses an interactive visualization based multi-dimension data analyzing method. The method comprises the following steps: acquiring data to be analyzed; determining attribute dimension to be analyzed and displayed of the data to be analyzed; performing cluster analysis on the data to be analyzed according to the determined attribute dimension; distributing different color to each cluster according to the cluster analyzing result; displaying an integrated map and a parallel coordinate map of the data to be analyzed according to the determined attribute dimension and the color distributed to each cluster; receiving first interaction operation triggered based on the parallel coordinate map, and updating the displayed parallel coordinate map and the integrated map. The invention also provides an interactive visualization based multi-dimensional data analyzing system. With the adoption of the method and the system, the problems that the interaction linking and analyzing of the multi-dimension attribute properties cannot be dynamically analyzed in existing multi-dimension data exploration and analysis, and the spatial distribution mode of the multi-dimension attribute properties and the incidence relation among the attribute dimension cannot be effectively expressed, can be solved.

Description

technical field [0001] The present invention relates to the technical field of data exploration and analysis, in particular to a multi-dimensional data analysis method and system based on interactive visualization. Background technique [0002] Data analysis is a process of exploration. Analysts process and analyze data through maps, graphics, data statistics, and computer algorithms, and then conduct dynamic interactions, find patterns, verify assumptions, and discover unknown information. [0003] At present, the traditional GIS (Geographic Information System / Geo-Information system, Geographic Information System) analysis method is generally used in the field of multi-dimensional data exploration and analysis, and this analysis method has certain limitations. [0004] For example, the usual practice of traditional GIS methods is to generate thematic maps for univariate classification, and then weighted and superimposed several thematic maps to achieve multivariate classifi...

Claims


Application Information

Patent Timeline
IPC IPC(8): G06F17/30G06K9/62
CPCG06F16/29G06F18/23
Inventor 李伯楠郭殿升
Owner 深圳市位和科技有限责任公司
Why Eureka
Try Eureka