Diagram building system and method for a signal data decomposition and analysis

a building system and signal data technology, applied in the field of diagnostic building systems and methods, can solve the problems of inability to know individual overall trend toward and change physiological parameters, inability to collate information for each time in a systematic way, and inability to effectively get their physical condition and related information

Inactive Publication Date: 2019-07-16
NAT CENT UNIV
View PDF11 Cites 0 Cited by
  • Summary
  • Abstract
  • Description
  • Claims
  • Application Information

AI Technical Summary

Benefits of technology

[0013]The intrinsic mode functions (IMFs) decomposed can be as fluctuations information of physiological parameters in these days, weeks or months. The non-oscillation residue has ruled out the influence of the transient noise or temporary fluctuations, therefore the non-oscillation residue can be used as individual overall trend toward and changes physiological parameters, so that users can effectively get their physical condition and related information.

Problems solved by technology

However, the physiological signals detected by the detectors are various and complex, and the information measured for each time cannot be collated in a systematic way.
The users only can know the current physical condition, but cannot know individual overall trend toward and changes physiological parameters.
The conventional health management systems are not only relatively large and complex, but also need professional human operations to analyze, so the cost is high and it requires more manpower and time consuming.

Method used


Image

  • Diagram building system and method for a signal data decomposition and analysis
  • Diagram building system and method for a signal data decomposition and analysis
  • Diagram building system and method for a signal data decomposition and analysis

Examples


first embodiment

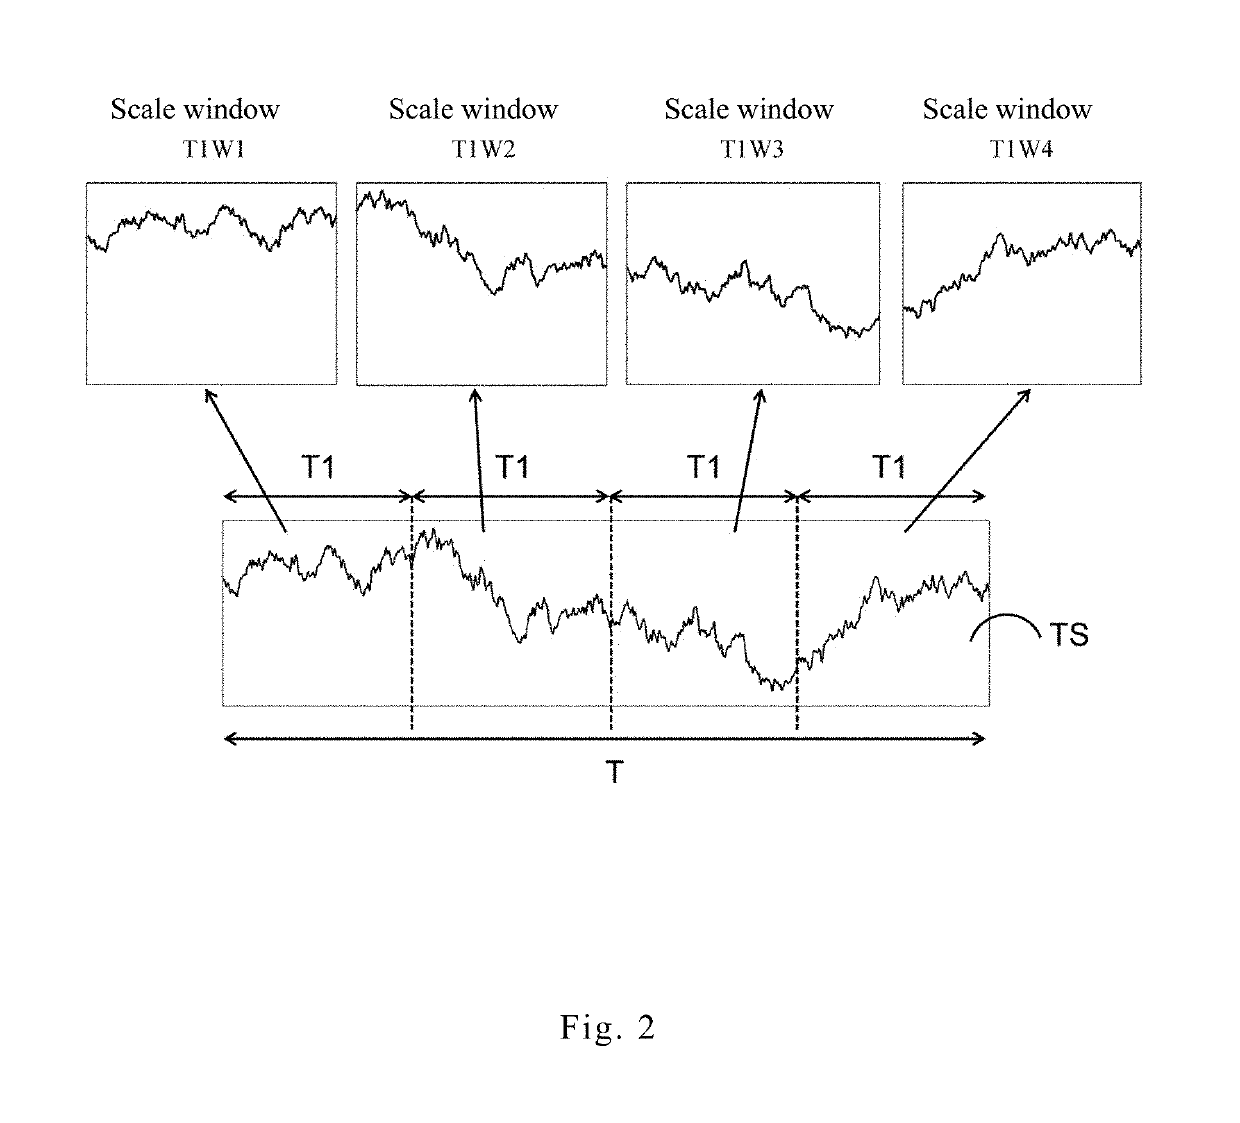
[0043]Please refer to FIG. 2 showing a diagram of the signal segmented in the invention. The segmenting processor 210 of the invention divides the signal data TS into a plurality of window scales according to one of time interval scales, wherein each time interval scale is one of time periods which the signal data with. In an embodiment, when the time period T is 600 seconds and the time interval scale T1 is 20 seconds, the signal data TS is divided into 30 window scales by the segmenting processor 210. When the time interval scale T1 is 40 seconds, the signal data TS is divided into 15 window scales, which is not limited herein.

[0044]Please refer to FIG. 2, in order to clearly describe the features of the invention, the signal data TS being divided into 4 window scales by the segmenting processor 210 based on the time interval scale T1 is taken as an example. The 4 window scales are respectively a window scale T1W1, a window scale T1W2, a window scale T1W3 and a window scale T1W4, ...

second embodiment

[0051]In another embodiment, please refer to FIG. 5 showing a diagram of the signal segmented in the invention. The segmenting processor 210 dividing the signal data TS into 6 window scales according to the time interval scale T2 is taken as an example. The 6 window scales are respectively a window scale T2W1, a window scale T2W2, a window scale T2W3, a window scale T2W4, a window scale T2W5, and a window scale T2W6, which is not limited herein.

[0052]The analyzing processor 220 repeats to decompose the window scale T2W1, the window scale T2W2, the window scale T2W3, the window scale T2W4, the window scale T2W5, and the window scale T2W6 by HHT algorithm to generate the quantized windows (T2W1F1, T2W1F2, T2W1F3, T2W1F4; T2W2F1, T2W2F2, T2W2F3, T2W2F4; T2W3F1, T2W3F2, T2W3F3, T2W3F4; T2W4F1, T2W4F2, T2W4F3, T2W4F4; T2W5F1, T2W5F2, T2W5F3, T2W5F4; T2W6F1, T2W6F2, T2W6F3, T2W6F4) respectively according to the first component F1, the second component F2, the third component F3, and the f...


PUM


Abstract

The present invention provides a diagram building system adapted for processing a signal with a time period. The diagram building system comprises a inputting device for receiving the signal; a computing device, dividing the signal into a plurality of window scales according to one of time interval scales; decomposing the window scales via HHT algorithm to generate a plurality of quantized windows according to different components; then, calculating the value of quantized windows with the same single-frequency component through a quantifying function to generate a plurality of specific frequency values; an outputting device, sequentially arranging the specific frequency values according to the time interval scales and the single-frequency components to form a visual diagram.

Description

CROSS-REFERENCE TO RELATED APPLICATIONS[0001]This is continuation-in-part application of U.S. application Ser. No. 14 / 273,082 filed on May 8, 2014, now pending, the entire disclosure of which is incorporated herein by reference.FIELD OF THE INVENTION[0002]The invention relates to a diagram building system and method, more particularly, to a diagram building system and method for a signal data analyzing to generate a three-dimensional variation visual diagram.BACKGROUND OF THE INVENTION[0003]As technology advances, more and more detectors are used to detect physiological signal, which can provide users detecting their physical condition by themselves. However, the physiological signals detected by the detectors are various and complex, and the information measured for each time cannot be collated in a systematic way. The users only can know the current physical condition, but cannot know individual overall trend toward and changes physiological parameters.[0004]The conventional techn...

Claims


Application Information

Patent Timeline
Patent Type & Authority Patents(United States)
IPC IPC(8): G06T11/20A61B5/02A61B5/00G16H40/63G06T11/00
CPCG06T11/206A61B5/02G16H40/63G06T11/001A61B5/7275
Inventor HUANG, NORDEN E.KUO, BO-JAULIN, YU-CHENGPENG, CHUNG-KANGLO, MEN-TZUNG
Owner NAT CENT UNIV
Why Eureka
Try Eureka