Teaching system including sensor aided ball

Inactive Publication Date: 2014-11-27
BATTELLE MEMORIAL INST
1 Cites 29 Cited by

AI-Extracted Technical Summary

Problems solved by technology

When experiments have been incorporated into the classroom lessons, they generally require substantial set up time and effort.
During which time the students may become disinterested or distracted.
Further, the experiments often require a leap of imagination, rather than a direct illustration, of the principle being taught.
One drawback to using these types of sensors in a classroom setting is that the sensors are complicated and difficult to use.
For example, one setup for collecting motion and pressure data for a ball involves connecting a sensor to...

Method used

[0029]Triggering data collection can have at least two purposes: (1) limiting the data displayed to only the timeframe of interest; and (2) conserving battery power. The trigger data may include a threshold value measured by a sensor 14 that can cause the controller 12 to change the frequency or sampling rate of the sensor(s) 14. The threshold value may be a specific value and may correlate to a specific sensor which may have a specific sensor identifier. The threshold value may be (a) a numerical start value or range of values; (b) a numerical stop value or range of values: (c) one or more indexed values from a table based on one or more sensor identifiers; (d) one or more indexed values based on the trigger data; (e) any of the foregoing as defined by a mathematical formula based on sensor data from one or more sensors, or (f) a combination of any of the foregoing. For example, threshold value may be a mathematical relationship between accelerometer readings in one direction that require a calculation of the difference between two readings, or a threshold value for a gravity may be calculated from readings in each of the x, y and z directions (such as requiring the square root of X2+Y2+Z2 to be calculated); or a threshold value may be calculated from a magnetometer reading and accelerometer reading, etc. Also, for example, communicating data for an experiment in free fall is more efficient when only the data related to the time period of free fall is collected and displayed to the user. Providing triggers for sensor data measurement and/or collection may also conserve power and battery life by allowing for the turning off of all non-participatory sensors during the time period prior to the start trigger, and turning off all sensors upon the stop trigger. Once triggered, any sensors may turn on within a few milliseconds to measure and/or record the data requested. The start and stop triggers may be as simple as instructing the sensor(s) to measure data when a pressure spike, free fall or movement is detected, or the triggers may be more complex such as those that are calculated or combined triggers. Prior to collecting data, the sensors being triggered may operate at a lower sampling rate, when possible, to provide additional decrease in power consumption. During the time period of data collection and/or recording the sampling rate of a sensor may increase and then return to a lower sampling rate once the stop trigger is detected.
[0032]Any of the preceding triggers may be applied together in a logical combination. For example, Boolean logic may be used consisting of AND, OR, XOR gates. Users may then construct simple combinations such as the ball rate of spin is greater than 200 degrees per second and the magnitude of acceleration is less than 0.1 g. The use of logical combinations greatly expands the number and types of available data collection schemes and, therefore, the number and types of experiments in which the ball may be used. In turn, the ball's use may be extended to teach the concepts of Boolean logic.
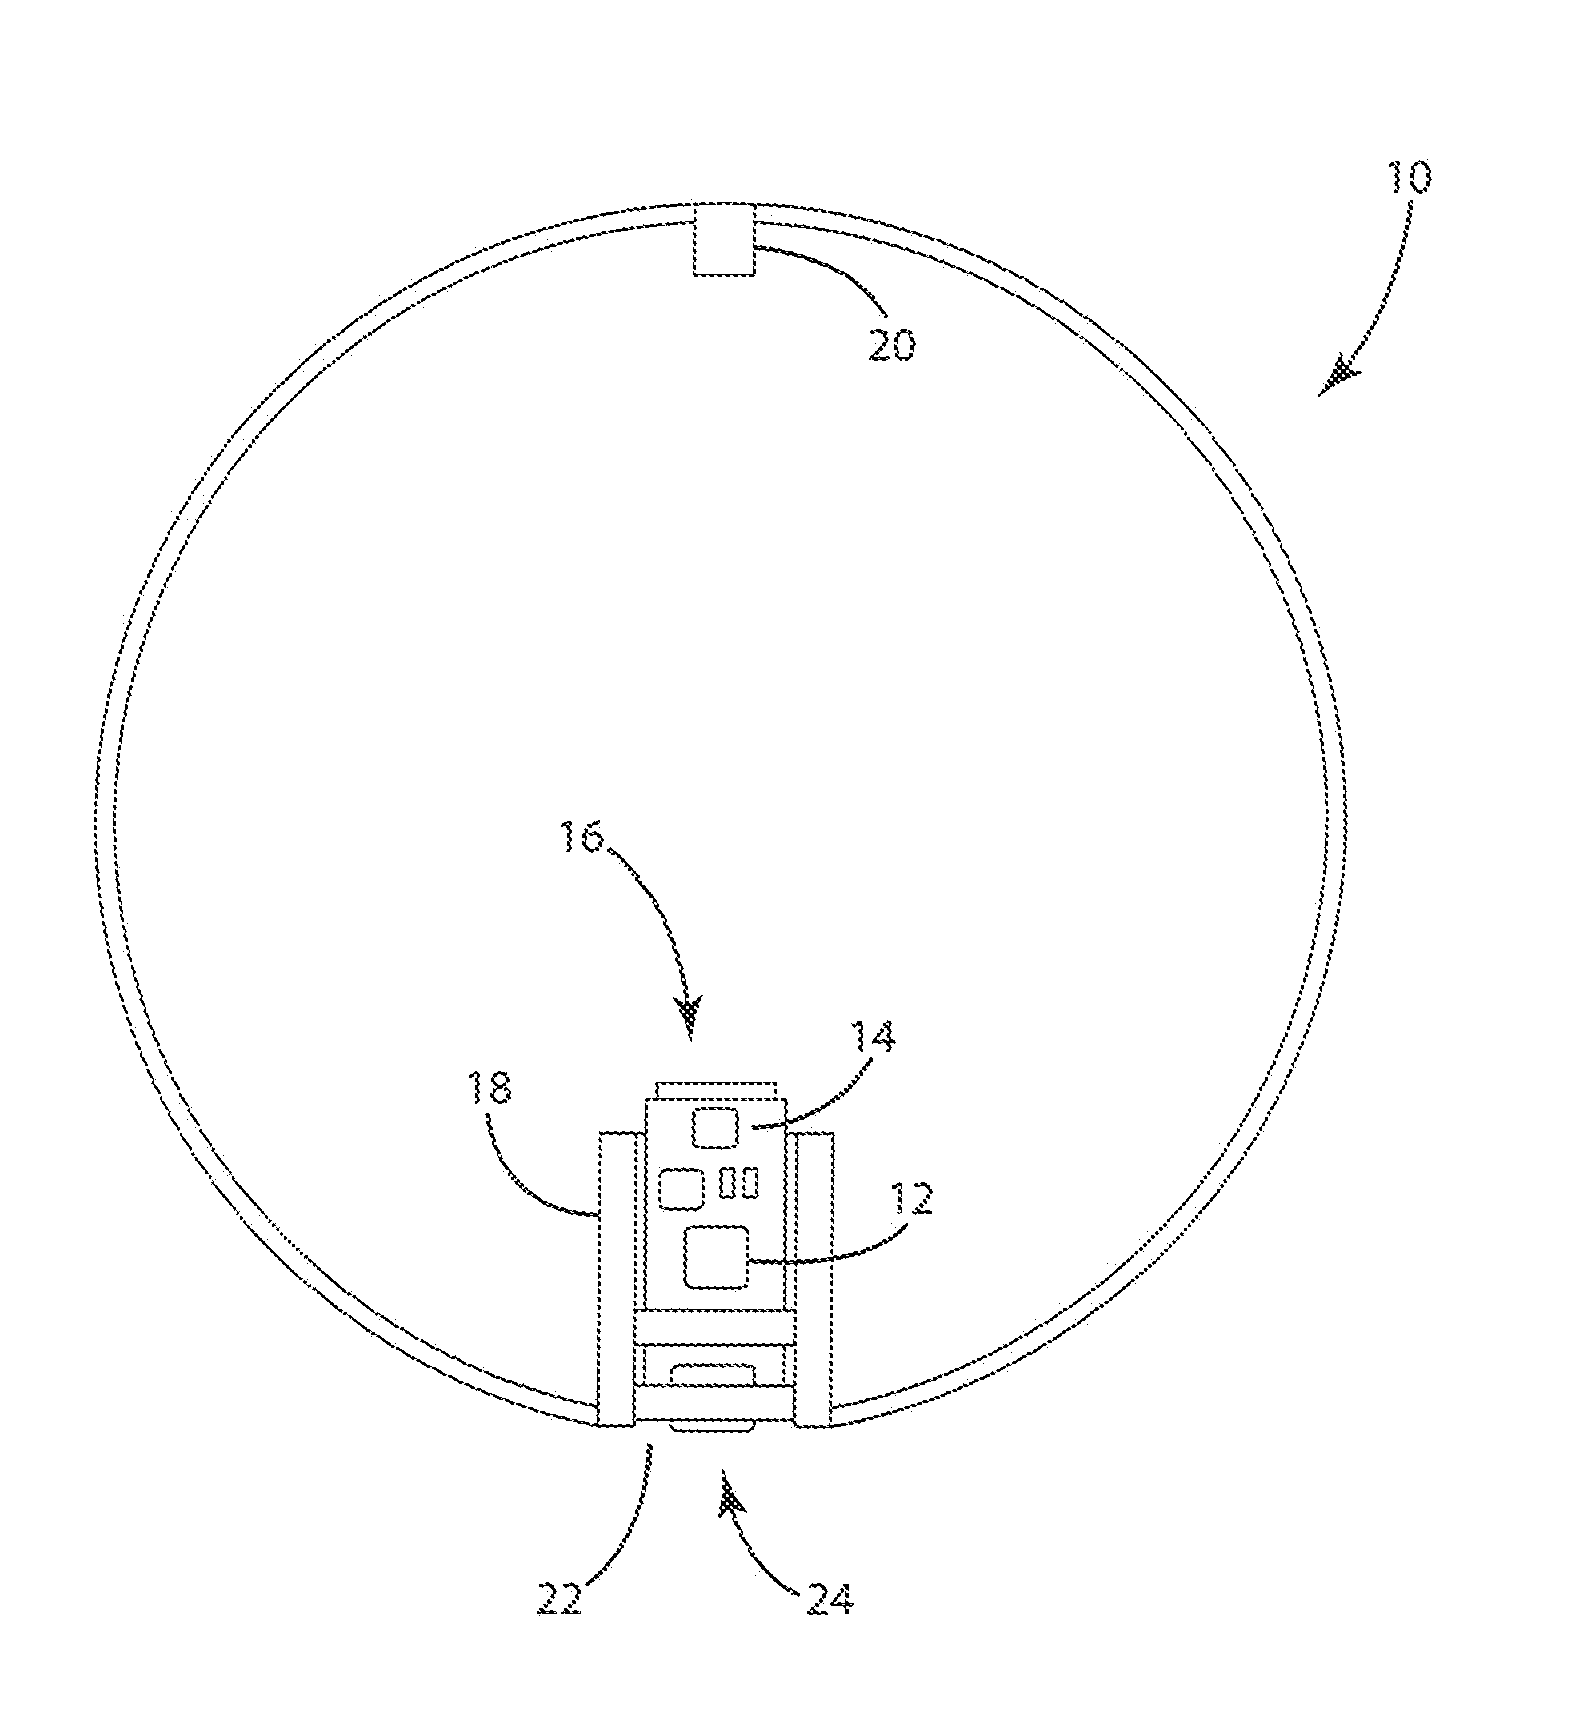
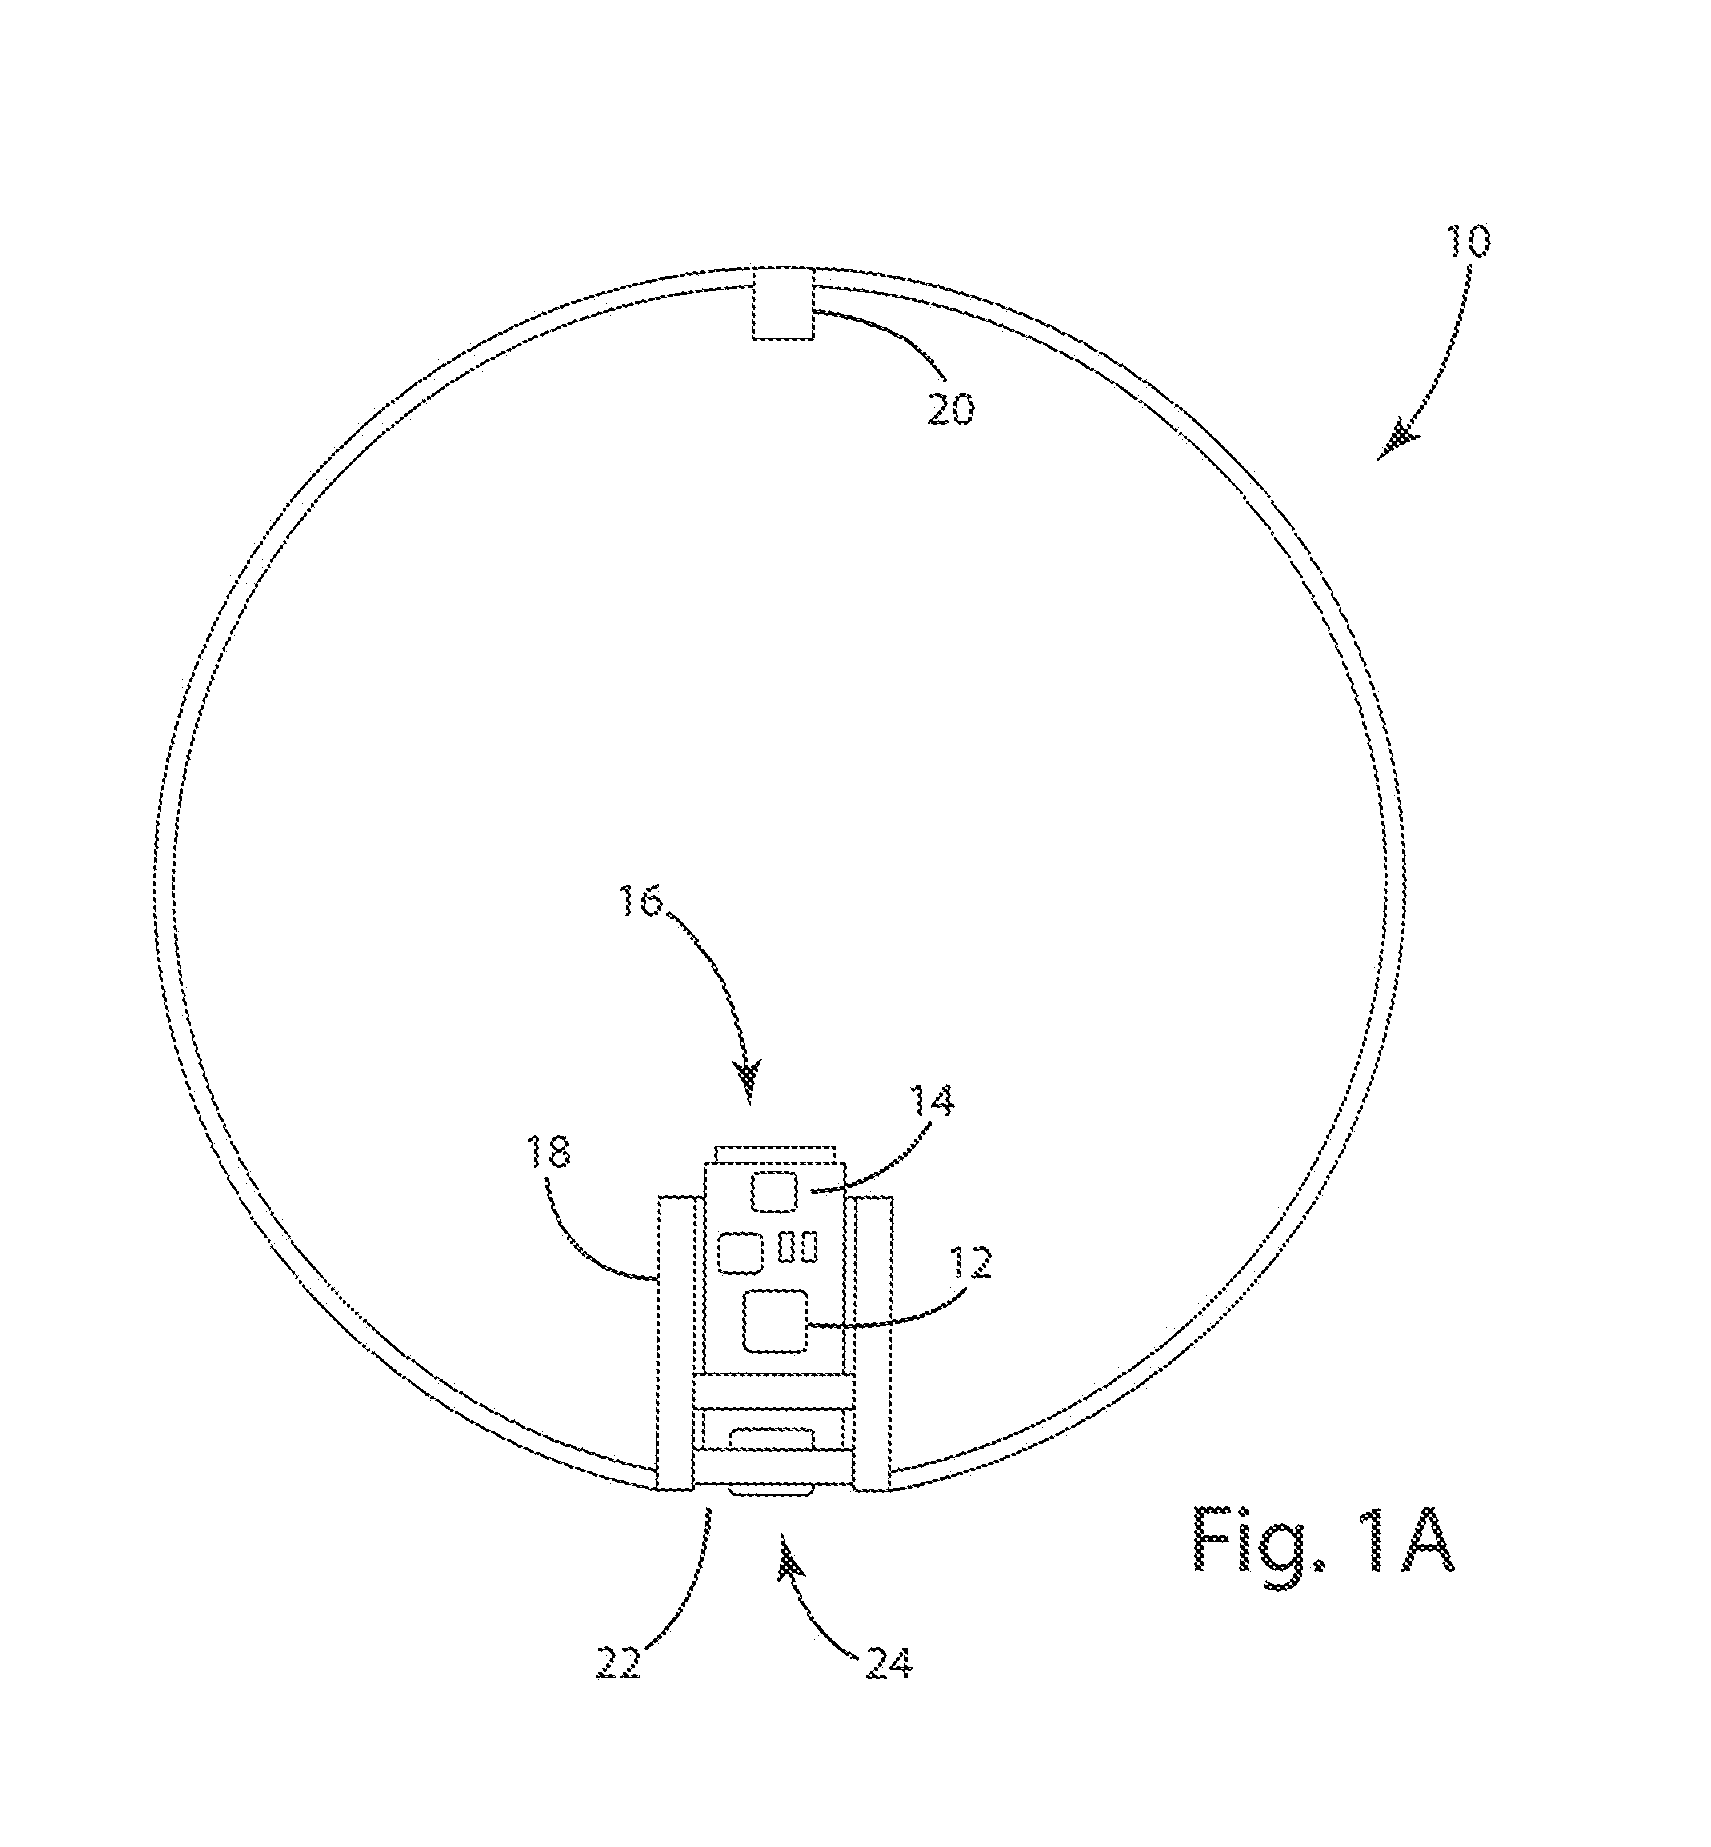
[0053]Managing power consumption of the sensor(s) can be beneficial from a power consumption standpoint and also can improve battery longevity. On the one hand, a longer on-time for the ball and its electronics is desired, on the other hand, it is desirable to keep the mass of the ball low. The former dictates a large battery size while the latter dictates a small battery size. By reducing the power consumption, the ball can be made to operate for the desired time duration while reducing battery size requirements. The battery management technique employed may selectively enable sensor(s) and the radio while leveraging sleep modes on the processor. The controller 12 as show in FIG. 1A, may be configured to monitor one or more sensors 14 for a trigger based on the trigger data and can be configured to change operation of the sensor(s) 14 upon detection of the trig...

Benefits of technology

[0009]According to any of the foregoing embodiments, the sensor ball, teaching system and/or method may allow a user to select from a list of pre-defined experiments which include predefined sensors and threshold values for controlling the measurements of the sensors. Alter...

Abstract

A sensor aided ball as a tool to teach math and science. The ball may include various sensors such as inertial, pressure, magnetic, and temperature sensors. Users can run experiments and then view the results on a computer, tablet, or phone. Measurements such as acceleration, angular rate, velocity, position, heading, pressure, and temperature can be displayed. The ball may be used within an associated system or method.

Application Domain

Educational models

Technology Topic

EngineeringTablet computer +3

Image

  • Teaching system including sensor aided ball
  • Teaching system including sensor aided ball
  • Teaching system including sensor aided ball

Examples

  • Experimental program(14)

Example

[0073]Example Experiment 1—Gravity. The ball can be dropped and measurements made at the beginning, during the fall, and at the end. The acceleration, velocity, and position can be plotted to show how the ball begins to accelerate at a constant rate when dropped. The linear relationship with velocity can be shown, followed by the squared relationship with position. Through the user interface of the external device, a user selects the experiment corresponding to gravity measurement. The device communicates instructions to the controller associated with the sensor ball and sets the accelerometer(s) in the sensor ball to initiate data collection upon detection of a start trigger, such as detecting a free fall (i.e., detecting acceleration of <0.1 g) and will continue data sample until a stop trigger is detected (i.e., acceleration of >0.1 g). The sensor ball may then be dropped from a height and let it hit the ground or catch it. When dropped the starting trigger occurs. When an acceleration above the stop magnitude is measured due to catching the ball or bounding it, the data collection ends. The user interface then displays the vector magnitude of acceleration during the test (converting body fixed ˜0 g acceleration to the space fixed ˜1 g acceleration), which will be constant, the integral of that acceleration which is velocity, and finally the integral of velocity which is position. The user can compare calculated position with how high the ball was dropped. The experiment could be extended by adding mass (e.g. taping coins) to the ball and showing how acceleration does not change because of mass. Here the 3 axis of accelerometers are used.

Example

[0074]Example Experiment 2—Ideal Gas Law (PV=nRT). Given the sensor ball is sealed, the number of moles of gas (n) will remain constant as will the ideal constant (R). Temperature may be varied by the experimenter and changes in pressure (P) inside the ball and its volume (V) may be observed. As a data collection starting trigger, in a circular buffer mode, data collection may be set to begin 5 seconds before pressure increase, (i.e., pressure>10 mPa above baseline). Data collection may continue until a stop trigger is detected (i.e., 5 seconds of constant pressure, pressure within 10 mPa of baseline for 5 s). The student turns on the experiment and then heats the ball. The ideal gas law, PV=nRT is experienced by recording a pressure increase linearly proportional to the temperature increase. The volume of the ball remains constant as does the number of moles (n), therefore only pressure (P) and temperature (T) change. The students could cool the ball in an ice bath to generate a similar but opposite reaction. Here the pressure sensor is used, common pressure sensors contain both a pressure and temperature sensing element.

Example

[0075]Example Experiment 3—Magnetic field's dependency on distance. The sensor aided ball can assist in teaching about magnetics. Magnetic fields can be applied to the ball to show the relationship with magnetic field and distance. Also the shape of the magnetic field can be explored. Data may be collected by a start trigger reading in a gyroscope associated with the sensor ball (i.e., a gyroscope measurement of >25 degrees/sec) and continue data collection until a stop trigger (i.e., a gyroscope reading of <25 degrees/sec) is measured. The experimental setup consists of a strong magnet mounted stationary alongside a space for the ball to roll into the magnet. The student rolls the ball at the magnet allowing it to strike the mounting and stop spinning. The ball will roll at a fairly constant speed over short distances as approaches the magnet. The resulting magnitude of the magnetic field vs time, and correspondingly space is then plotted. This plot will show how the magnetic field measured relates to the cube of distance. Here the 3 gyroscopes and 3 magnetometers are used.

PUM

no PUM

Description & Claims & Application Information

We can also present the details of the Description, Claims and Application information to help users get a comprehensive understanding of the technical details of the patent, such as background art, summary of invention, brief description of drawings, description of embodiments, and other original content. On the other hand, users can also determine the specific scope of protection of the technology through the list of claims; as well as understand the changes in the life cycle of the technology with the presentation of the patent timeline. Login to view more.
Why Eureka
Try Eureka