Cardiovascular Risk Event Prediction and Uses Thereof

a risk event and cardiac disease technology, applied in the field of cardiac disease risk event prediction, can solve the problems of modest performance of existing risk factors and biomarkers, low response rate to interventions, behavior and lifestyle changes, etc., and achieve the effect of improving the prediction performance, reducing the risk of cardiac disease, and determining the risk associated with protein measurements more accurately

Inactive Publication Date: 2015-06-18
SOMALOGIC INC
View PDF9 Cites 7 Cited by
  • Summary
  • Abstract
  • Description
  • Claims
  • Application Information

AI Technical Summary

Benefits of technology

[0023]As discussed above, cardiovascular events may be avoided by aggressive treatment if the propensity for such events can be accurately determined. Prior art multi-marker tests either require the collection of multiple samples from an individual, or require that a sample be partitioned between multiple assays. It would be preferred to provide a prognostic assay that would require only a single biological sample, measured in a single assay, rather than multiple samples for different analyte types (lipids, proteins, metabolites) or panels of analytes. The central benefit to a single sample test is simplicity at the point of use, since a test with multiple sample collections is more complex to administer and this forms a barrier to adoption. An additional advantage derives from running that single sample in a single assay for multiple proteins. A single assay should mitigate unwanted variation due to calibrating multiple assay results together. The test which forms the basis of this application is such a “single sample, single assay” test. This combination of single sample and single assay is a novel feature of this cardiovascular event risk test which addresses the logistic complexity of collecting multiple samples and the problems and biohazards involved in splitting samples into multiple aliquots for multiple independent analytical procedures.
[0029]The measurement of GFR is clearly useful in predicting the risk of a CV event. However, the clinical measurement of GFR involves urine collection over 24 hours, which does not meet the subject standard of a “single sample, single assay” test. Other estimates of GFR are less onerous; however, to meet the goal of a “single sample” prognostic test, the strategy underlying the subject invention sought the use of the protein measurements themselves to provide GFR information for the risk analysis. For example, in the Table 3 ten marker model, the protein ESAM strongly predicts CV event risk due to its correlation with GFR. After correcting the measurements of the protein ESAM to remove the correlation with estimated GFR, ESAM is no longer predictive of risk. This use of a protein such as ESAM to convey the biological signal related to GFR in a “single sample, single assay” represents a novel advance for the prognosis of a CV event.
[0055]The angiopoietin 2 is surprisingly useful in prognosing a secondary cardiovascular event for individuals on statins. Statins have been reported in the prior art to not only reduce the risk of a secondary cardiovascular event, but also cause an increase in angiopoietin 2. This rise in angiopoietin 2 would have been expected to negate it's use as a biomarker. Unexpectedly, angiopoietin 2 has demonstrated that it is a good marker for prediction of secondary cardiovascular events in high risk individuals.
[0061]In addition to providing prognosis of CV event risk based on protein measurements alone, the subject method also provides the advantage of a more complete picture derived from taking into account simple information such as gender, medication, other markers such as LDL cholesterol, HDL cholesterol, total cholesterol, and other conditions such as diabetes. Such models can be built upon the existing Table 3 ten protein model introduced here.

Problems solved by technology

Unfortunately, the receiver-operating characteristic curves, hazard ratios, and concordance show that the performance of existing risk factors and biomarkers is modest (AUCs of ˜0.75 mean that these factors are only halfway between a coin-flip and perfection).
Firstly, it is too long term: it gives 10-year risk calculations but humans discount future risks and are reluctant to make behavior and lifestyle modifications based on them.
Secondly, it is not very responsive to interventions: it's most heavily weighted factor is chronological age, which cannot decline.
Thirdly, within the high risk population envisioned here, the Framingham factors fail to discriminate well between high and low risk: the hazard ratio between high and low quartiles is only 2.
These factors have routinely been combined into algorithms but unfortunately they do not capture all of the risk (the most common initial presentation for heart disease is still death).
In fact they probably only capture half the risk.
The addition of novel biomarkers to clinical risk scores has been disappointing.
Thus, optimal management requires aggressive intervention to reduce the risk of a cardiovascular event in those patients who are considered to have a higher risk, while patients with a lower risk of a cardiovascular event can be spared expensive and potentially invasive treatments, which are likely to have no beneficial effect to the patient.
Some of the key issues that affect the identification of biomarkers include over-fitting of the available data and bias in the data.
The utility of two-dimensional electrophoresis is limited by low detection sensitivity; issues with protein solubility, charge, and hydrophobicity; gel reproducibility; and the possibility of a single spot representing multiple proteins.
For mass spectrometry, depending on the format used, limitations revolve around the sample processing and separation, sensitivity to low abundance proteins, signal to noise considerations, and inability to immediately identify the detected protein.
Limitations in immunoassay approaches to biomarker discovery are centered on the inability of antibody-based multiplex assays to measure a large number of analytes.
Even very good antibodies are not stringent enough in selecting their binding partners to work in the context of blood or even cell extracts because the protein ensemble in those matrices have extremely different abundances.)
Sandwich immunoassays do not scale to high content, and thus biomarker discovery using stringent sandwich immunoassays is not possible using standard array formats.
Lastly, antibody reagents are subject to substantial lot variability and reagent instability.
Thus the sample preparation required to run a sufficiently powered study designed to identify and discover statistically relevant biomarkers in a series of well-defined sample populations is extremely difficult, costly, and time consuming.
For example, a potential marker could be unstable to the process, the concentration of the marker could be changed, inappropriate aggregation or disaggregation could occur, and inadvertent sample contamination could occur and thus obscure the subtle changes anticipated in early disease.
It is widely accepted that biomarker discovery and detection methods using these technologies have serious limitations for the identification of diagnostic or predictive biomarkers.
These limitations include an inability to detect low-abundance biomarkers, an inability to consistently cover the entire dynamic range of the proteome, irreproducibility in sample processing and fractionation, and overall irreproducibility and lack of robustness of the method.
Further, these studies have introduced biases into the data and not adequately addressed the complexity of the sample populations, including appropriate controls, in terms of the distribution and randomization required to identify and validate biomarkers within a target disease population.
Although efforts aimed at the discovery of new and effective biomarkers have gone on for several decades, the efforts have been largely unsuccessful.
Most of these proposed biomarkers, however, have not been confirmed as real or useful biomarkers, primarily because the small number of clinical samples tested provide only weak statistical proof that an effective biomarker has in fact been found.
That is, the initial identification was not rigorous with respect to the basic elements of statistics.
During that same time frame, however, the FDA approved for diagnostic use, at most, three new protein biomarkers a year, and in several years no new protein biomarkers were approved.

Method used


Image

  • Cardiovascular Risk Event Prediction and Uses Thereof
  • Cardiovascular Risk Event Prediction and Uses Thereof
  • Cardiovascular Risk Event Prediction and Uses Thereof

Examples


example 1

Multiplexed Aptamer Analysis of Samples

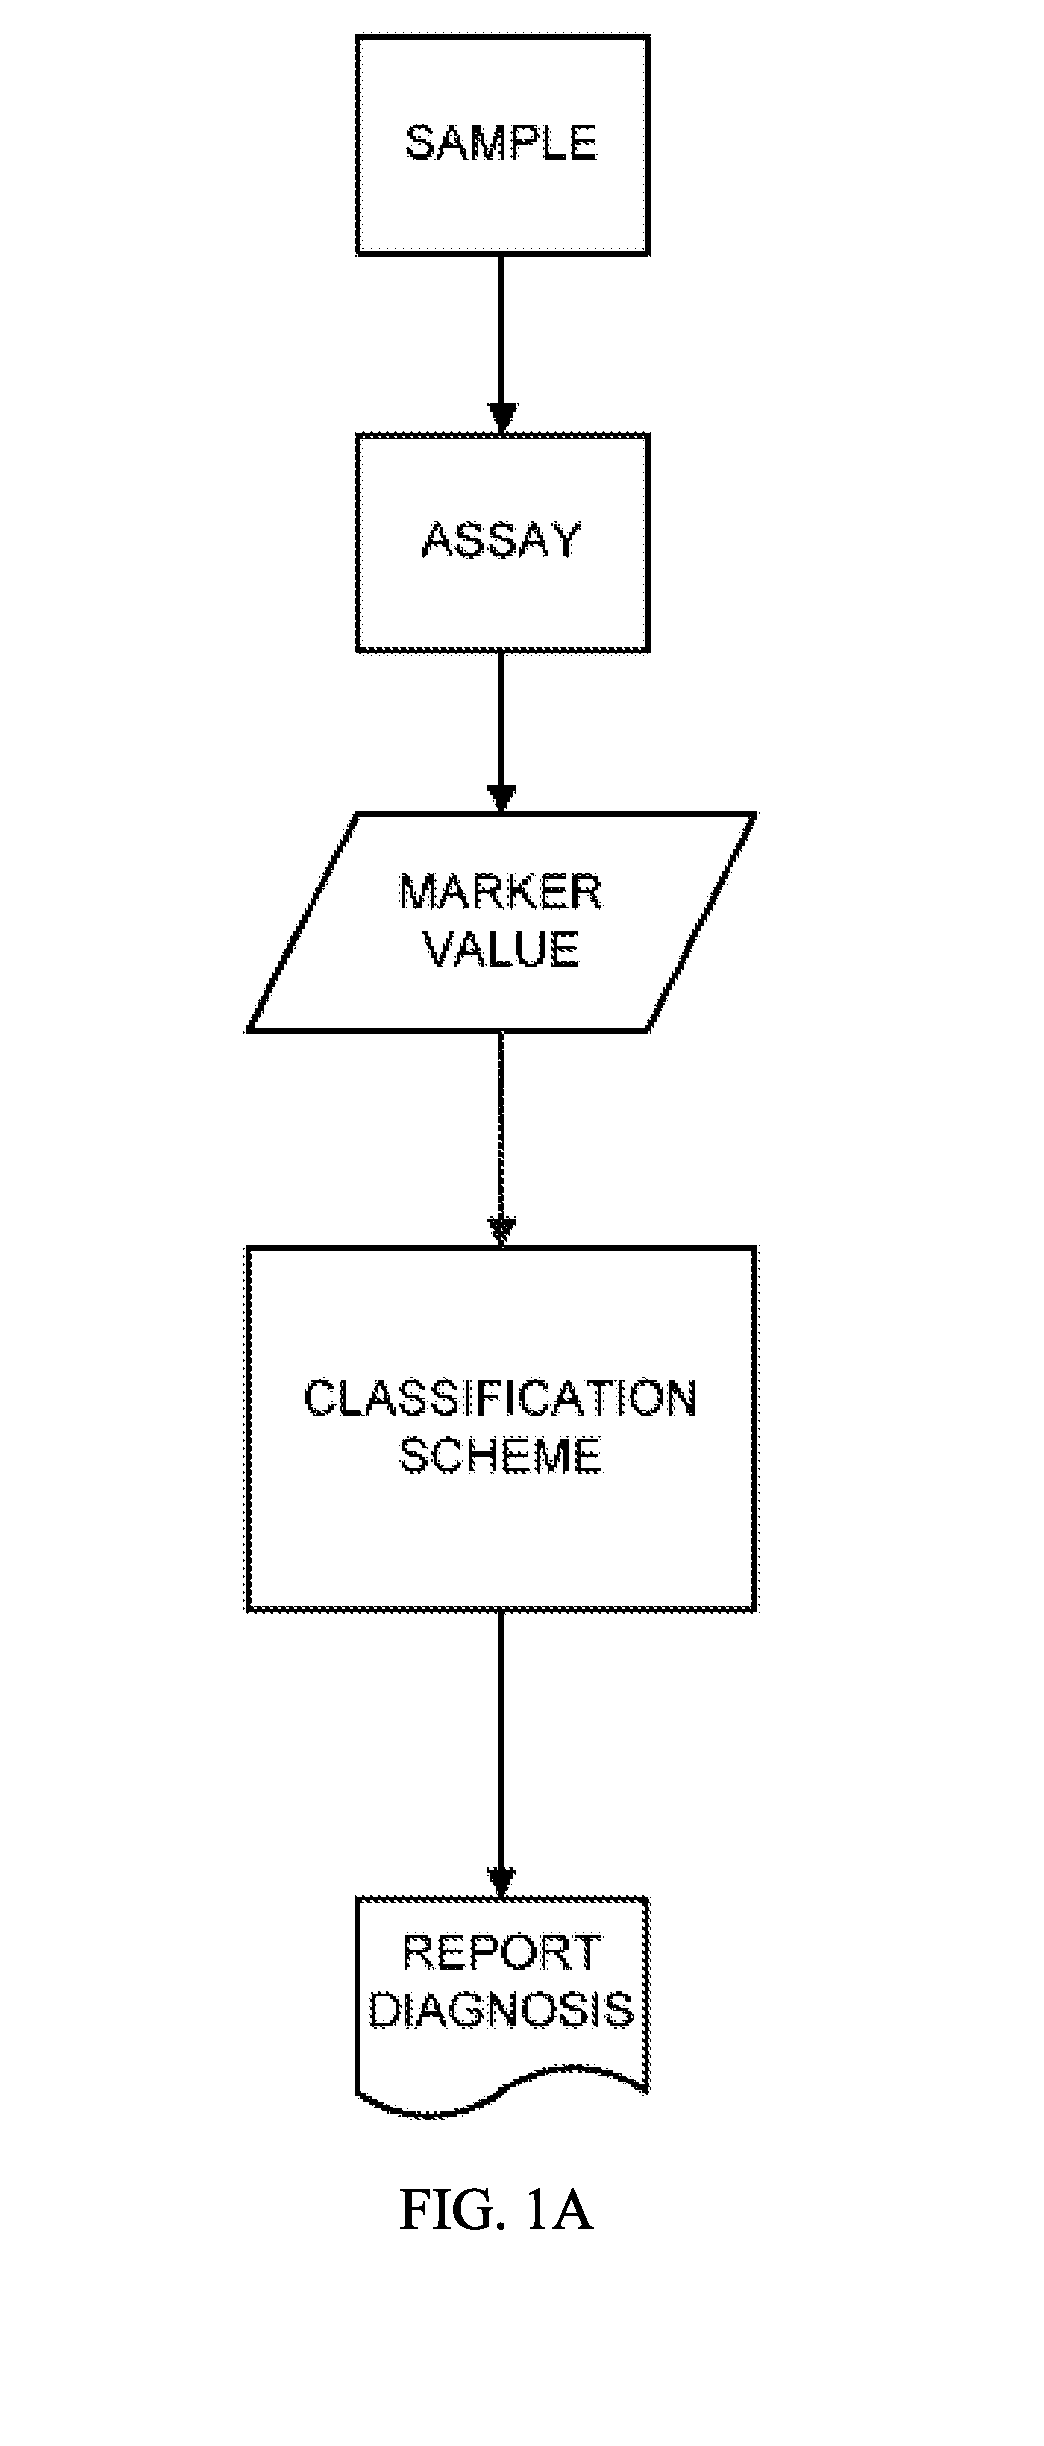
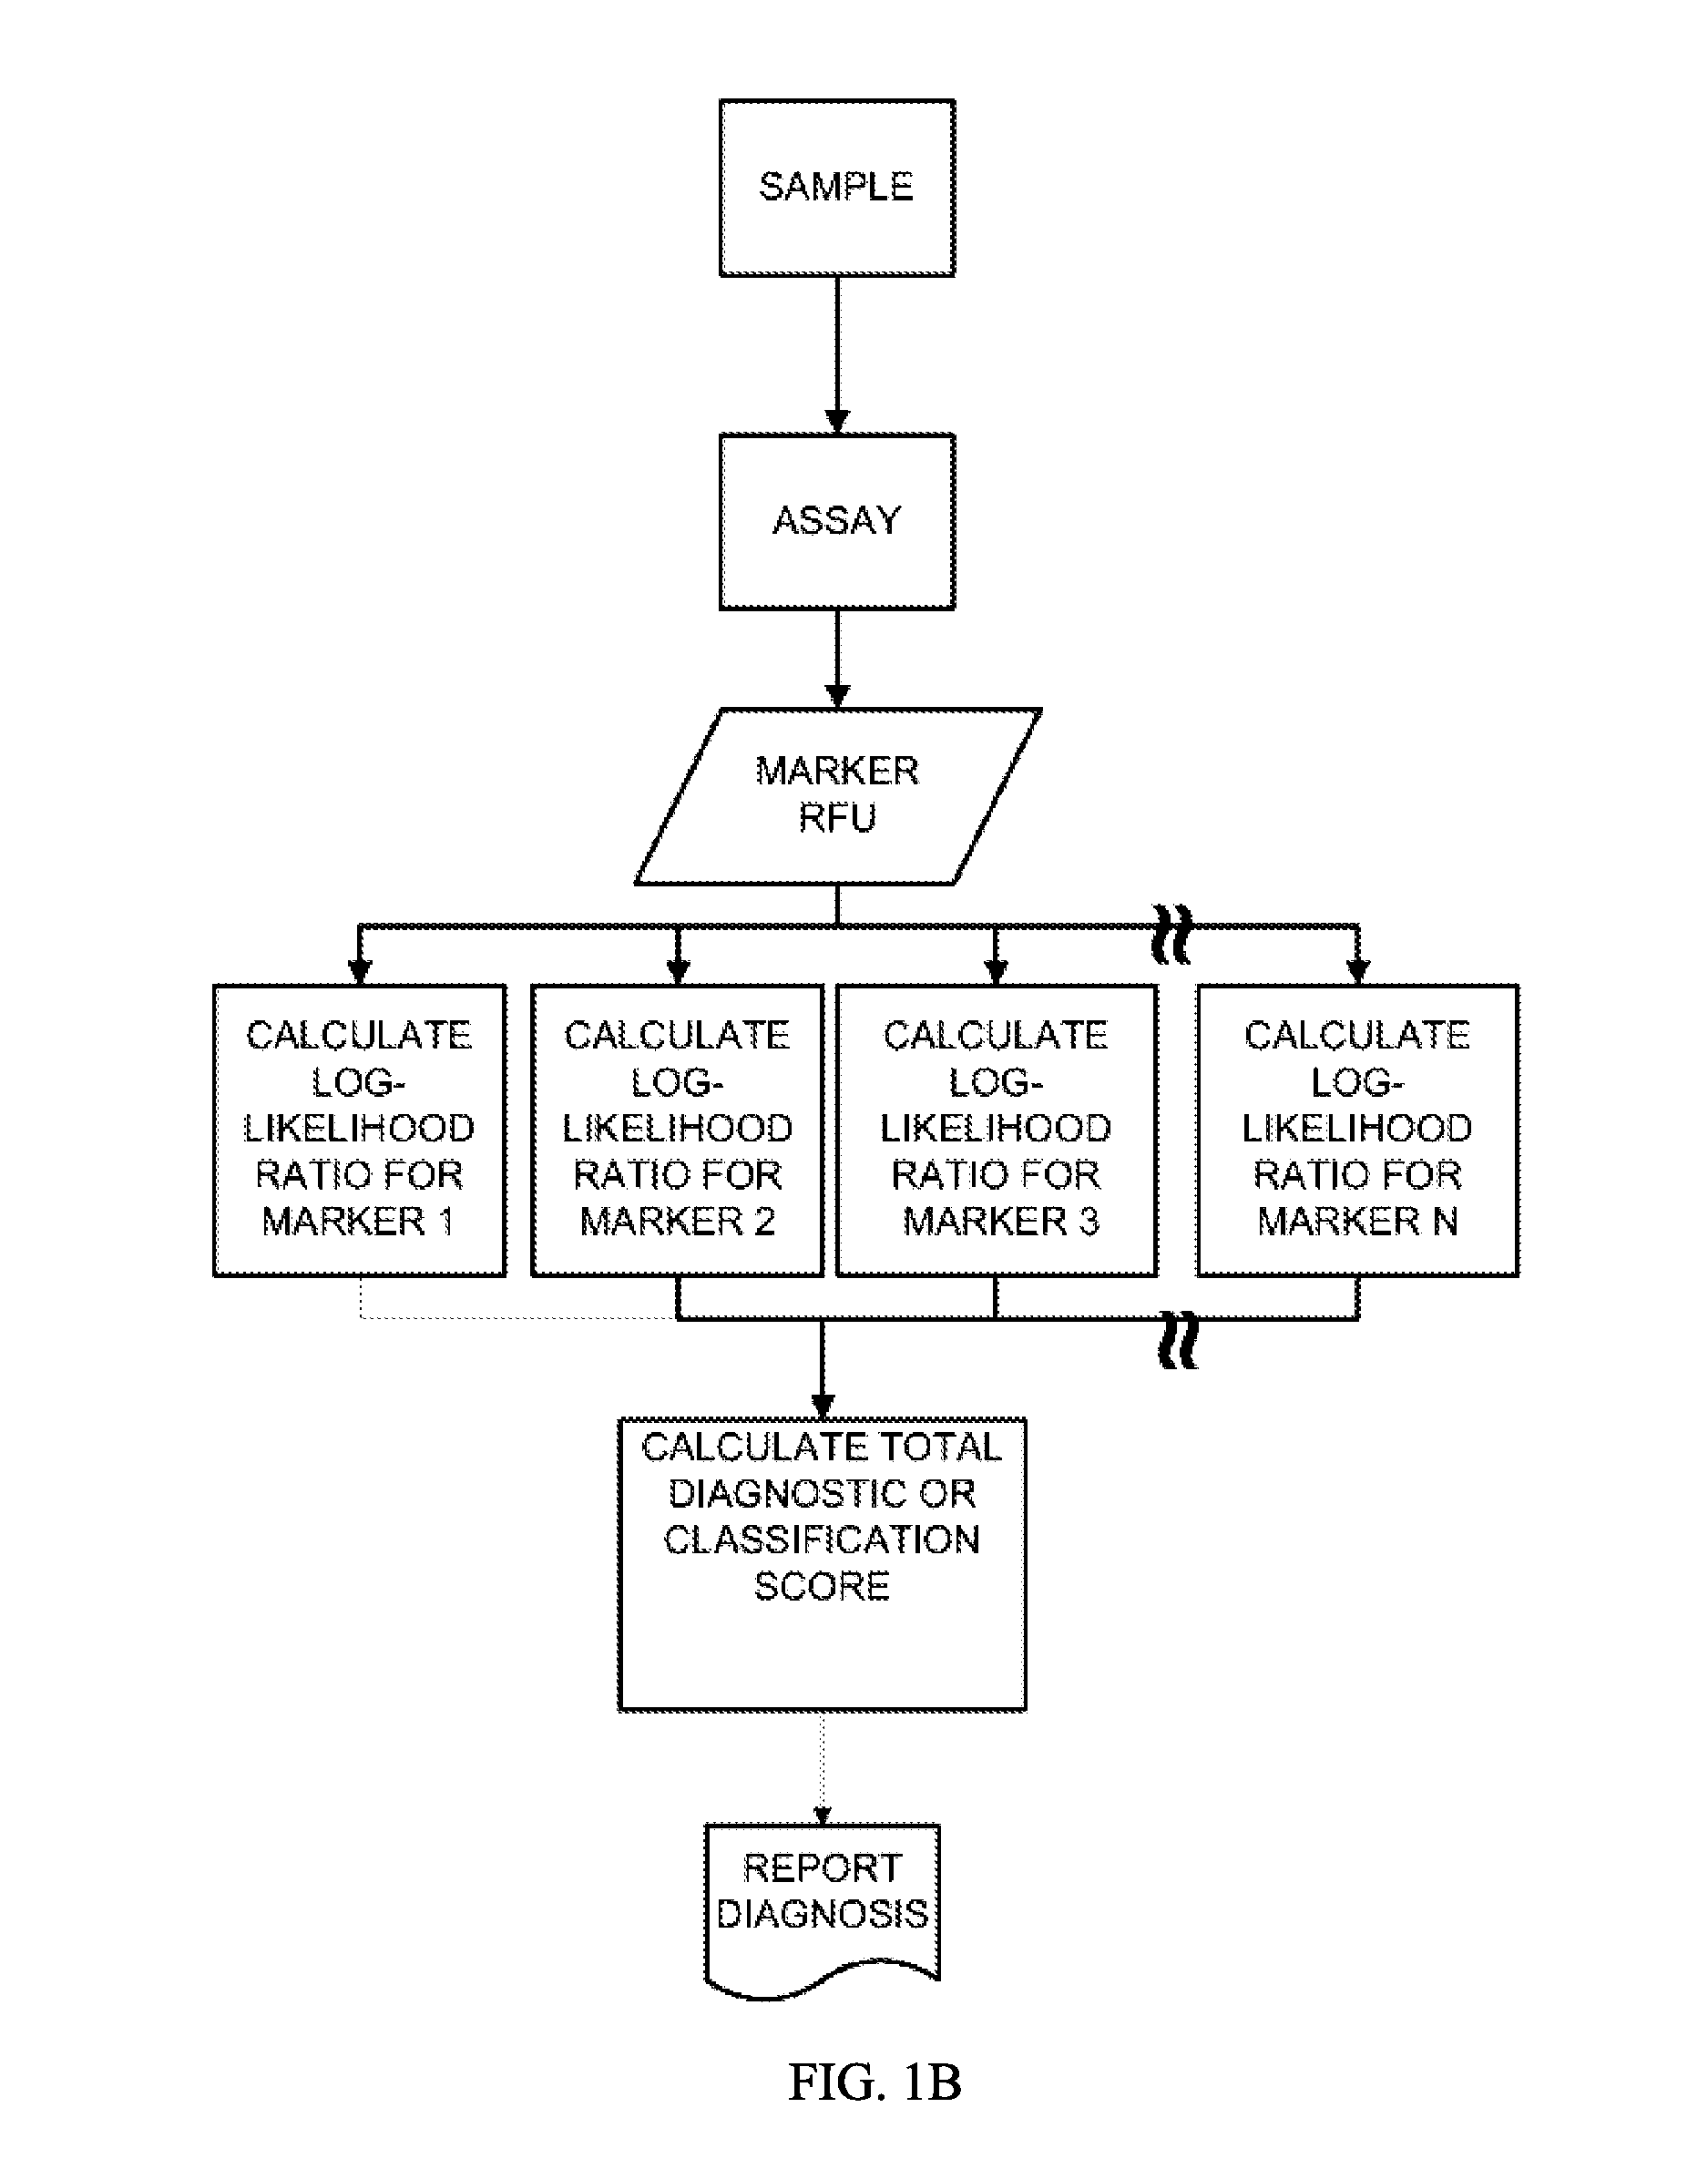
[0235]This example describes the multiplex aptamer assay used to analyze the samples and controls for the identification of the biomarkers set forth in Table 1. The general protocol for analysis of a sample is illustrated in FIGS. 1A and 1B. Commonly in medical studies of survival data, the Cox proportional hazard model is employed to produce a risk score from multiple covariates of pathological state. In this work, we have employed this simple and well known approach to devise a model from the population data in the Heart and Soul study, for example, suitable for application to individual samples according to this flexible and widely used Cox Proportional Hazard Formalism. The biomarker values are combined as shown in FIG. 1B by taking the log ratio of the biomarker measurements relative to the normal levels. The Cox model uses the exponential of the weighted sum of these log ratios to produce an estimate of the hazard ratio to the normal popu...

example 2

Biomarker Identification

[0280]The identification of potential CV event biomarkers was performed for prediction of risk of a CV event in a population of individuals in the San Francisco Bay Area. Participants had to meet one of the following enrollment criteria for this study: prior myocardial infarction, angiographic evidence of greater than 50% stenosis in 1 or more coronary vessels, exercise-induced ischemia by treadmill or nuclear testing, or prior coronary revascularization. Exclusion criteria included recent myocardial infarction, inability to walk around 1 block, and plans to relocate. Fasting blood samples were collected, and serum and plasma aliquots were stored at −70° C. The multiplexed SOMAmer affinity assay as described in Example 1 was used to measure and report the RFU value for 1034 analytes in each of these 987 samples.

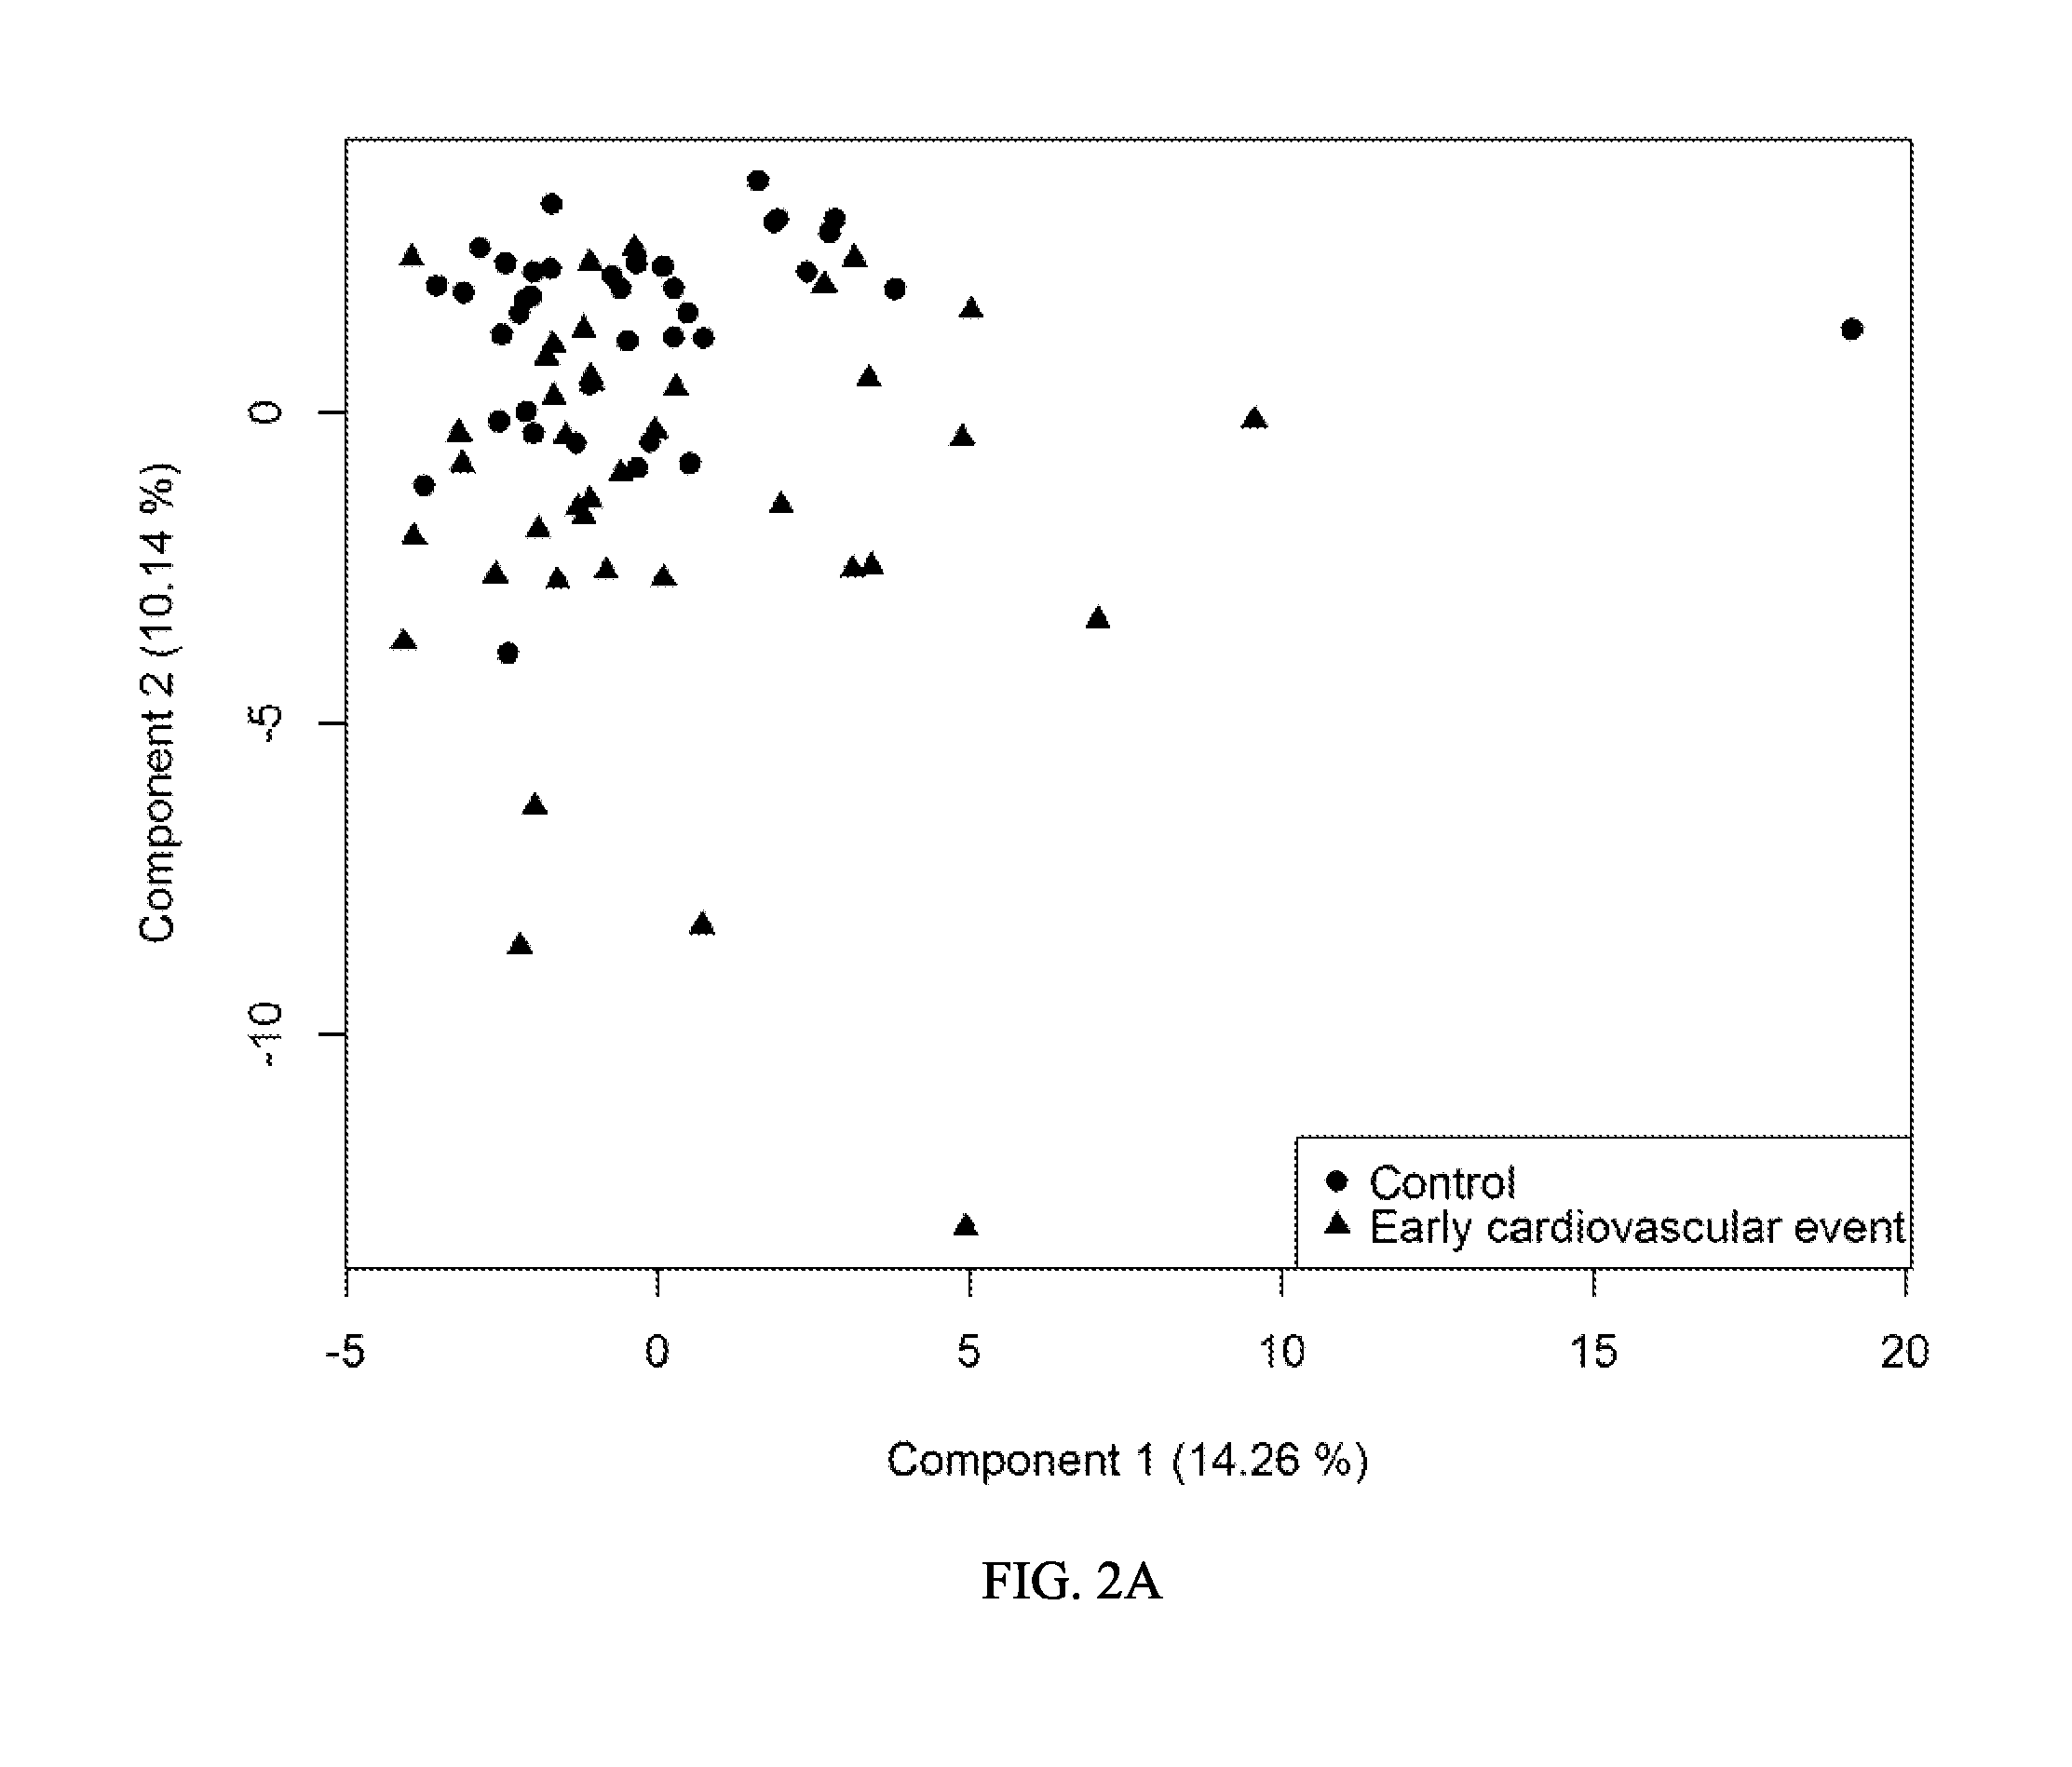
[0281]In order to identify a set of biomarkers associated with occurrence of events, the combined set of control and early event samples were analyzed...

example 3

Univariate Analysis of the Relationship of Individual Proteins to Time to CV Event

[0284]The Cox proportional hazard model (Cox, David R (1972). “Regression Models and Life-Tables”. Journal of the Royal Statistical Society. Series B (Methodological) 34 (2): 187-220)) is widely used in medical statistics. Cox regression avoids fitting a specific function of time to the cumulative survival, and instead employs a model of relative risk referred to a baseline hazard function (which may vary with time). The baseline hazard function describes the common shape of the survival time distribution for all individuals, while the relative risk gives the level of the hazard for a set of covariate values (such as a single individual or group), as a multiple of the baseline hazard. The relative risk is constant with time in the Cox model.

[0285]The method involved fitting 1092 simple univariate Cox models to all signals. Forty-six proteins have P-values (Wald, Abraham. (1943). A Method of Estimating ...


PUM

PropertyMeasurementUnit
timeaaaaaaaaaa
timeaaaaaaaaaa
volumesaaaaaaaaaa

Abstract

The present disclosure includes biomarkers, methods, devices, reagents, systems, and kits for the evaluation of risk of a caradiovascular (CV) Event within 5 years. In one aspect, the disclosure provides biomarkers that can be used alone or in various combinations to evaluate risk of a CV event within 5 years. In another aspect, methods are provided for evaluating risk of a CV event within 5 years in an individual, where the methods include detecting, in a biological sample from an individual, at least one biomarker value corresponding to at least one biomarker selected from the group of biomarkers provided in Table 1. In a further aspect, methods are provided for evaluating the risk of a CV, where the methods include detecting, in a biological sample from an individual, at least one biomarker value corresponding to at least one biomarker selected from the group of biomarkers provided in Table 2. In a further aspect, methods are provided for evaluating the risk of a CV event in an individual, generally within 5 years, where the methods include detecting, in a biological sample from an individual, at least one biomarker value corresponding to at least one biomarker selected from the group of biomarkers provided in Table 3.

Description

RELATEDNESS OF THE INVENTION[0001]The subject application is a continuation application of U.S. application Ser. No. 13 / 631,567, filed Sep. 28, 2012, which claims the benefit of priority from U.S. Provisional Application No. 61 / 541,828, filed Sep. 30, 2011, each of which is incorporated herein in its entirety.FIELD OF THE INVENTION[0002]The present application relates generally to the detection of biomarkers and a method of evaluating the risk of a future cardiovascular event in an individual and, more specifically, to one or more biomarkers, methods, devices, reagents, systems, and kits used to assess an individual for the prediction of risk of developing a Cardiovascular (CV) Event over a 5 year period. Such Events include but are not limited to myocardial infarction, stroke, congestive heart failure or death.BACKGROUND[0003]The following description provides a summary of information relevant to the present application and is not an admission that any of the information provided o...

Claims


Application Information

Patent Timeline
Patent Type & Authority Applications(United States)
IPC IPC(8): G01N33/68
CPCG01N33/6872G01N2800/50G01N2333/51G01N2800/32G01N33/6893G01N2800/60G16H50/30G16H10/40G16H50/20G01N2333/96494C12Q1/6881C12Q1/6883G01N33/54306
Inventor GILL, ROSALYNN DIANNEWILLIAMS, STEPHEN ALARICSTEWART, ALEX A.E.MEHLER, ROBERTFOREMAN, TRUDISINGER, BRITTA
Owner SOMALOGIC INC
Why Eureka
Try Eureka