Traffic Volume Estimation

a traffic volume and estimation technology, applied in the direction of measurement devices, instruments, traffic movement detection, etc., can solve the problems of difficult to measure and estimate traffic volume, limited scope, and limited methods,

Active Publication Date: 2017-10-26
HERE GLOBAL BV
View PDF2 Cites 75 Cited by
  • Summary
  • Abstract
  • Description
  • Claims
  • Application Information

AI Technical Summary

Problems solved by technology

Traffic volume, however, is difficult to measure and estimate.
These methods are both expensive, limited in scope, and may need to be constantly updated as traffic patterns change.
Permanent sites may be limited in that the sensors are expensive, sometimes require construction, and may only cover a fraction of the total roadway.
Temporary sites may provide a snapshot of data, but not substantial information to predict or model volume over a longer period of time.
The result of the attempts to capture traffic volume data may be spotty, inconsistent, and unreliable data.
For traffic volume estimates, probe devices do not work as well as for measuring traffic speeds.
The speed measurement alone does not allow for a determination of traffic volume.
However, a uniformly distributed traffic volume is a false assumption as some roads are more likely to be travelled than other roads for different time periods.
In both these examples, no report and multiple reports, a simple count of the probe reports may lead to an inconsistent prediction of traffic volume.
Another downside of the method is that fast-moving vehicle may speed through segments (10-meter), and as such leaves less footprints than expected.
As such, using a session identifier method may underestimate the traffic volume on high functional class road (e.g. freeway or major arterial) where speeds are large in relationship to the segment length or sub-segment length.
A segment that had multiple lanes closed for a period of time (e.g. a week) may have decrease probe distribution for that time period and as such may have an abnormally low probe distribution probability.
For example, large trucks may not be permitted on a road segment or only for certain hours.
As such, the probe distribution may not correctly predict an accurate volume if the fleet of probe vehicles is weighted towards large trucks.
Weather that is occurring during probe report generation may affect the volume of traffic on the roadways.
A blizzard, for example, may force most vehicles off the streets.
For example, a sporting event may cause increased volume over the expected normal traffic volume.
The sensor data may be limited and as such may only provide a small training set for a limited time period.
Closing a street or lane may cause unwanted volume to be shifted to alternative routes leading to unintended consequences.
For example, a roadway with high volume and low speed may be beneficial for a billboard while one with low volume and high speed may be less desirable.
Traffic volume may affect the quality and quantity of data being received from the sensors.
More traffic volume may mean additional obstacles to track and avoid.
More traffic data may also indicate additional potential for collusions.
Additionally, the illustrations are merely representational and may not be drawn to scale.

Method used


Image

  • Traffic Volume Estimation
  • Traffic Volume Estimation
  • Traffic Volume Estimation

Examples


Embodiment Construction

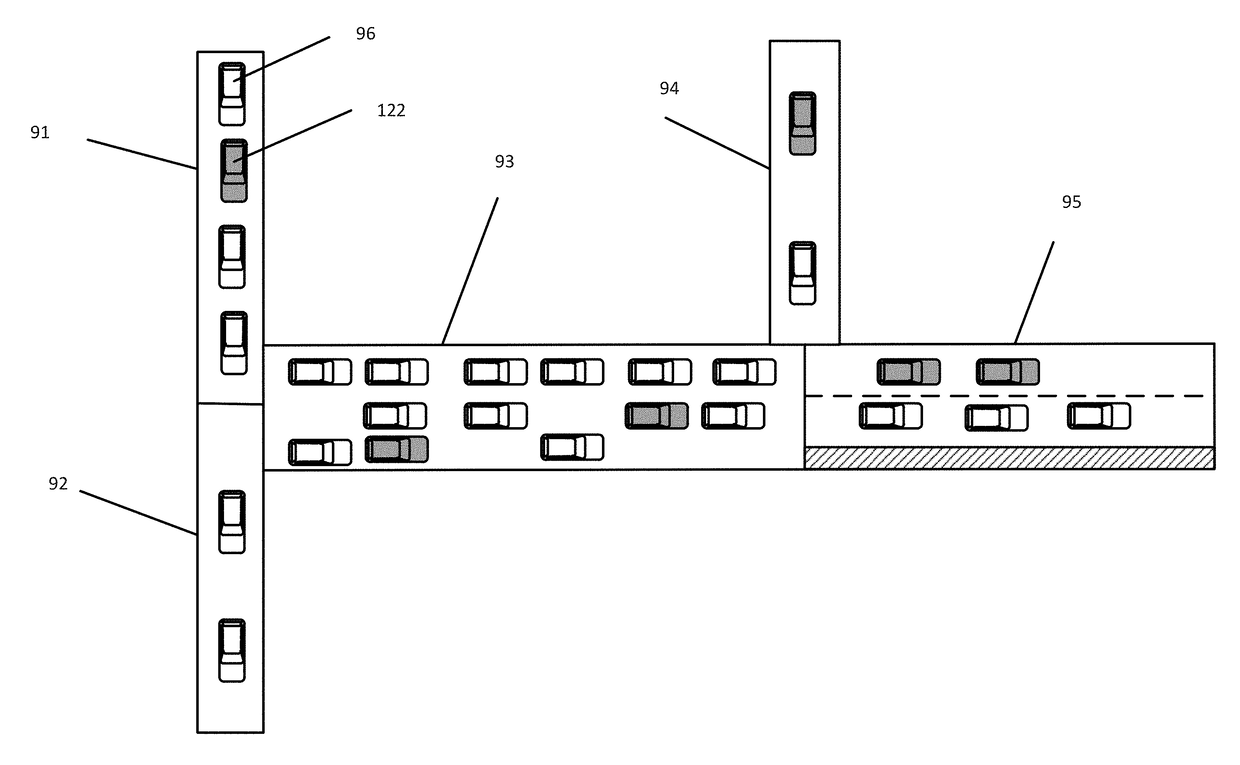
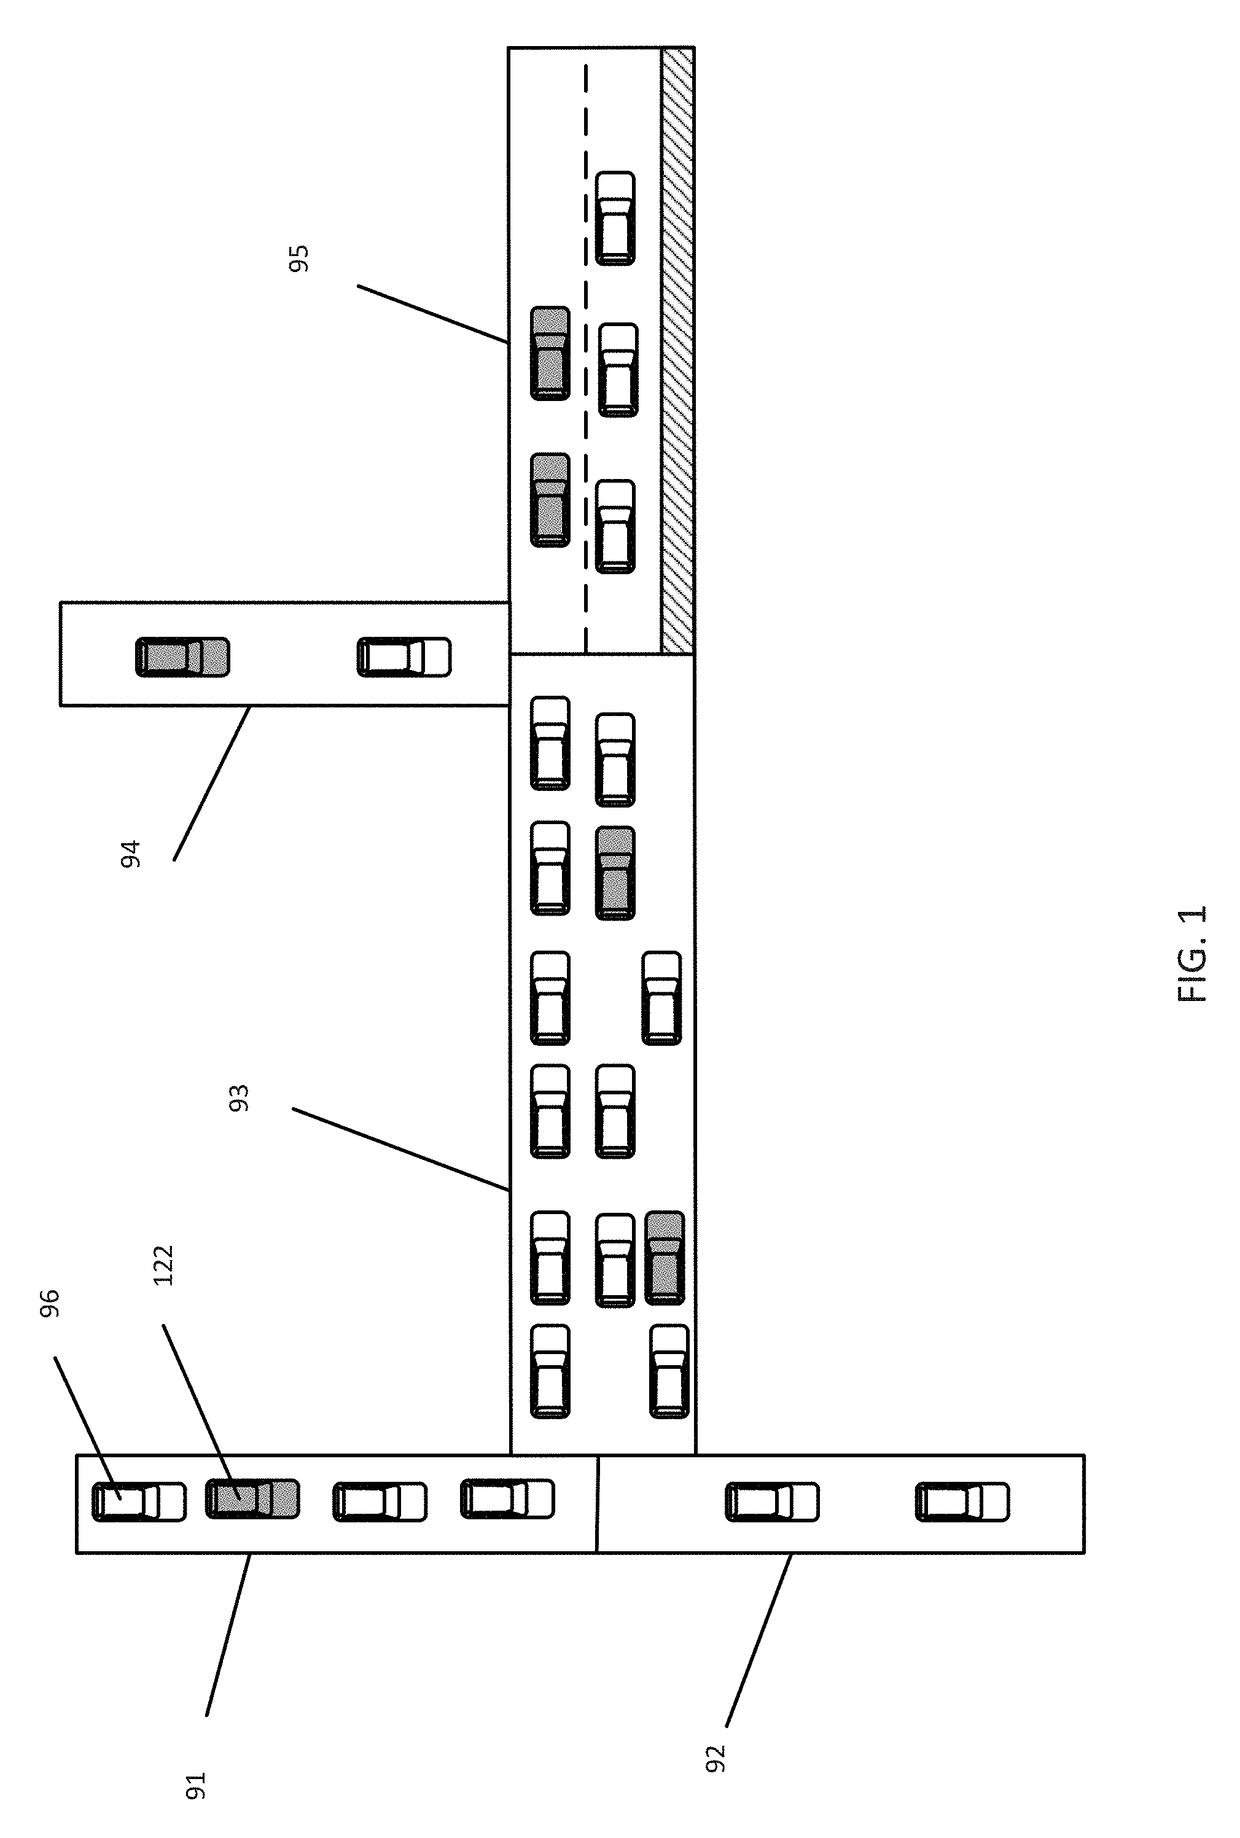
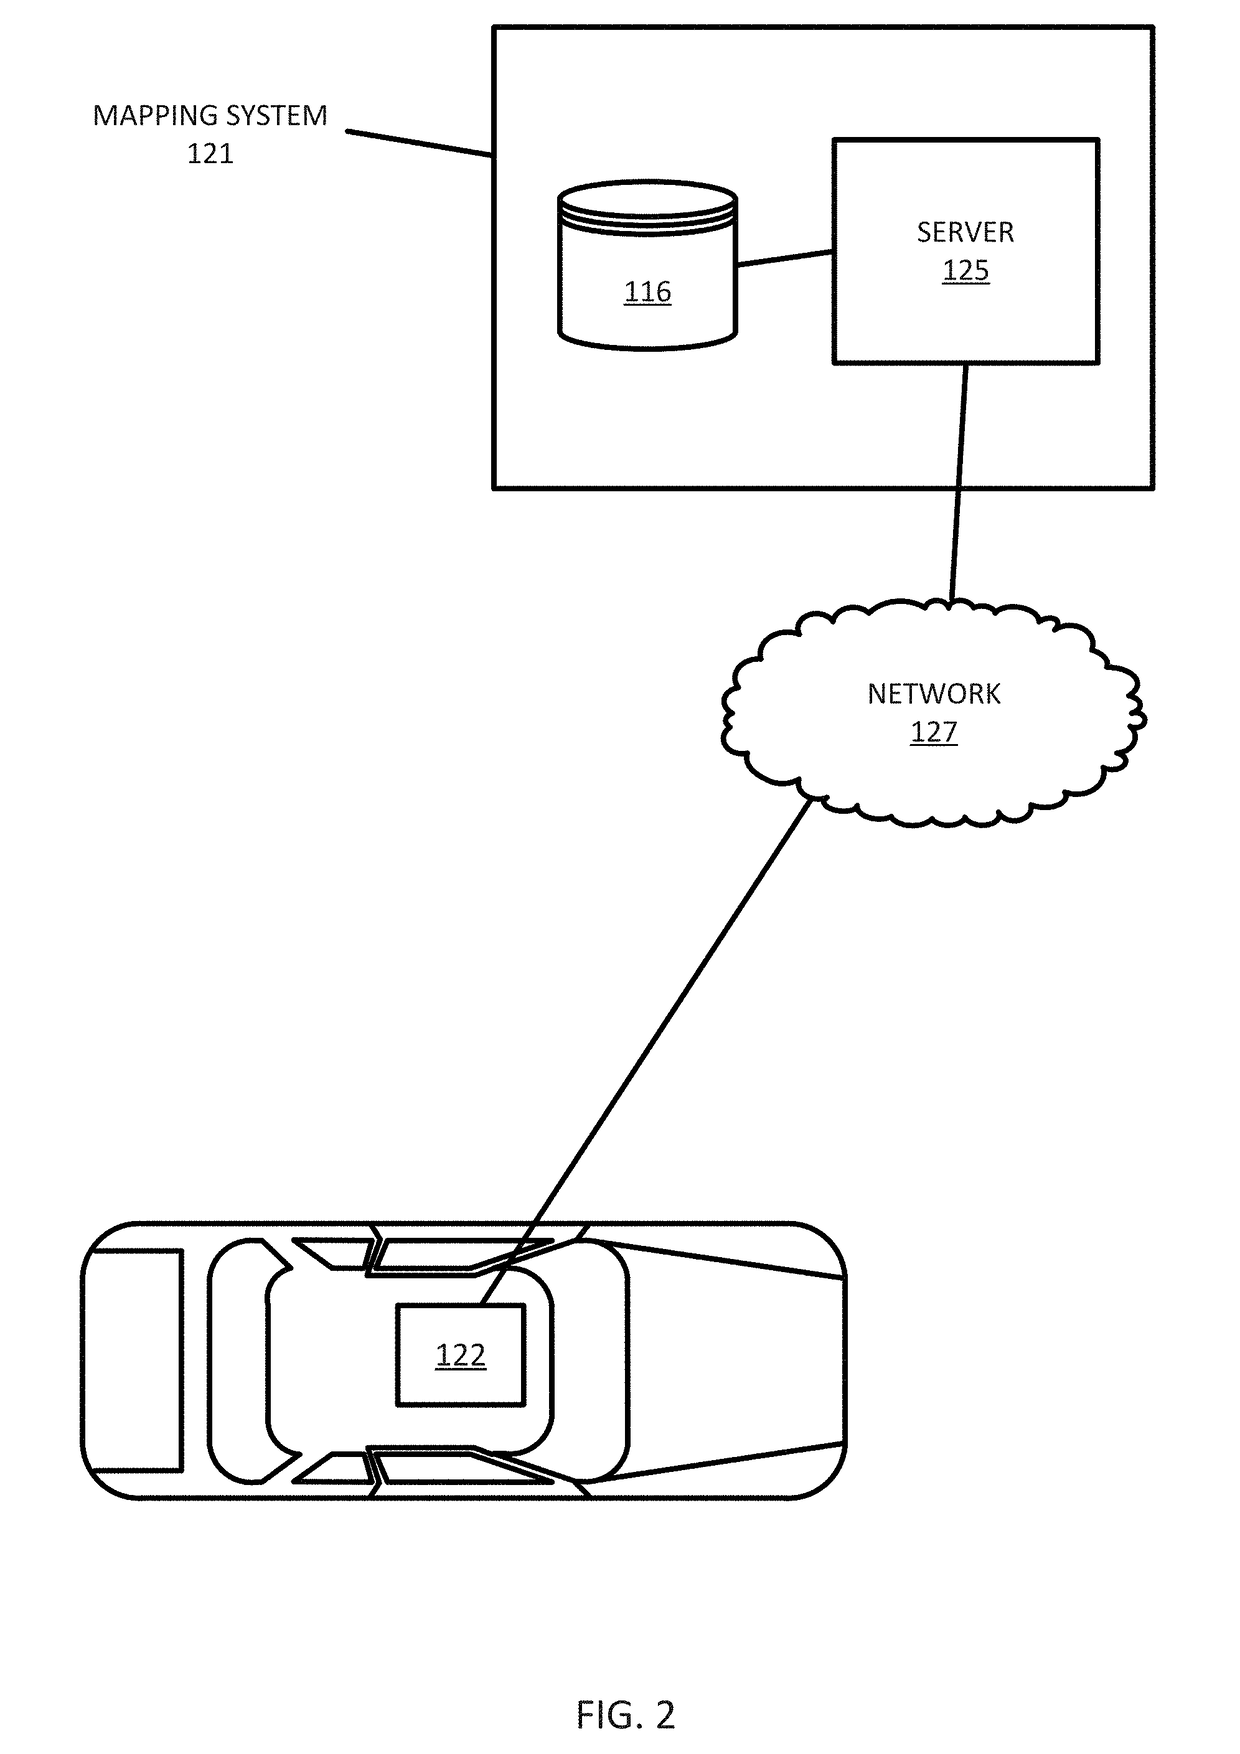
[0020]The following embodiments relate to systems and methods for estimating traffic volumes. Probe vehicles traveling through the network collect data for specific times and locations. The probe data over a period of time is used to generate a probe distribution that estimates the probability for a vehicle to be at a link at a specific time. The probe distribution and probability is adjusted using road attributes and other factors. The resulting model may be used to estimate traffic volume for road segments at various times.

[0021]Probe devices, such as those embedded in vehicles or included in navigation devices have been introduced as crowd-sourced collection devices. Probe devices provide decent coverage with low cost and low maintenance. Probe devices have performed particularly well for traffic speed estimates as the probe devices collect data at multiple locations over multiple time periods. The data collected, e.g. speed reading for a vehicle, is highly useful for predicting ...


PUM


Abstract

Systems and methods for using a plurality of probe reports to augment a geographic database with traffic volume data. The plurality of probe reports are identified for a road segment for a time period. A probe value is determined for the road segment for the time period based on the plurality of probe reports. A probe probability value is calculated for the road segment for the time period based on the probe value. The probe probability value is adjusted using road attributes. The adjusted probe probability value is used to estimate traffic volume. The geographic database is augmented with the estimated traffic volume.

Description

FIELD[0001]The following disclosure relates to navigation devices or services.BACKGROUND[0002]Traffic volume estimates may be used for multiple purposes. Governments use traffic volume estimates as a proxy for crash rates, evaluation of infrastructure management needs, air quality, compliance and validation of travel demand model predictions. Navigation systems use traffic volume for calculating routes and generating travel times. City planners, event organizers, and developers use traffic volume to both predict and plan. Traffic volume, however, is difficult to measure and estimate. Current systems use actual observations or roadside sensors to collect traffic volume information. These methods are both expensive, limited in scope, and may need to be constantly updated as traffic patterns change.[0003]Traffic volume data may be collected at permanent and temporary roadside sensors. At permanent sites, loop detectors, weight-in-motion sensors, and / or other equipment is installed for ...

Claims


Application Information

Patent Timeline
Patent Type & Authority Applications(United States)
IPC IPC(8): G08G1/01G01S19/13
CPCG01S19/13G08G1/0125G08G1/0112G08G1/0129G08G1/0133G08G1/0141G08G1/096816G08G1/096827G08G1/096838G08G1/096844
Inventor ZHAO, YUNJIEGIURGIU, GAVRILANASTASSOV, ANTON
Owner HERE GLOBAL BV
Why Eureka
Try Eureka