Price optimization system

a price optimization and price technology, applied in the field of price optimization system, can solve the problems of difficult forecasting cost and function, complex function for forecasting cost, and complex function for forecasting demand

Inactive Publication Date: 2009-04-21
INT BUSINESS MASCH CORP
View PDF90 Cites 108 Cited by
  • Summary
  • Abstract
  • Description
  • Claims
  • Application Information

AI Technical Summary

Benefits of technology

[0057]The data is then subjected to a third error detection and correction process, which detects the effects of closed stores and certain other erroneous records (Step 1027). Keeping in mind that one advantage of the present invention is that very little client input is required to achieve accurate results, the inventors contemplate error correction without further input (or very little input) from the client. In accord with the principles of the invention, stores that demonstrate no product movement (product sales equal to zero) over a predetermined time period are treated as closed. Those stores and their records are dropped from the process. In a preferred embodiment, the predetermined time period is three (3) months.
[0058]With continued reference to FIG. 10, Step 1027, the third error detection and correction also includes analysis tools for detecting the presence of erroneous duplicate records. The data is examined, in particular checking records for, date, product type, store at which the product was sold (or just “store”), price, units (which refers variously to units sold or unit sales volume), and causal variables. Causal variables are those factors which influence sales volume (a variable which can cause an increase in product sales e.g., coupons, sales promotion ads, sale prices, sale price on some complementary product, enhanced sales displays, more advantageous sales location within a store, etc.). Analysis is performed to remove the discrepant records such that only one of the records is kept as part of the analyzed data and that causal information for a particular time period is recorded.
[0060]RecordCausalNumberDateStoreProductUnitsPriceVariable112 / 5 YD101.991212 / 5 YD101.991312 / 12YD101.991412 / 12YD151.892512 / 19YD121.991612 / 26YD91.991For example, using record #1, the date of record is 12 / 5, the store is store “Y”, the product is product type “D”, units sold for that date are 10 at a price of 1.99. The causal variable is usually abbreviated with a code symbol (e.g., numbers). Here, “1” is a symbol for no causal variable, i.e., normal sales conditions. Whereas, examining, for example, record #3 includes a causal variable (code symbol 2) which, for example, will represent an advertisement concerning product “D”.
[0061]Discrepant records are identified and corrected. For example, if two records have the same exact values (such as record #1 and record #2), it is assumed that one such record is an erroneous duplicate and only one record is kept as part of the analyzed dataset, for example, only record #1 is retained.
[0062]If two records with the same date, product id, and store id have multiple records with different causals, they are combined into a single record, with the two prices maintained in separate dataset variables, units summed across the two records, and the causal variables representing something other than a normal state being represented by new dataset variables.
[0063]The following table shows an updated version of the above table. Record 2 was deleted because it is identical to Record 1. Records 3 and 4 were combined into a single record (i.e., combined into a single Record 3) with new causal variables defined for Advertisement and Advertisement Price. Records 5 and 6 did not change because there was no duplicate information.

Problems solved by technology

As a result, the function for forecasting demand may be very complex.
As a result, the function for forecasting costs may be very complex.
For a chain of stores with tens of thousands of different products, forecasting costs and determining a function for forecasting demand are difficult.
The enormous amounts of data that must be processed for such determinations are too cumbersome even when done by computer.
Further, the methodologies used to forecast demand and cost require the utilization of non-obvious, highly sophisticated statistical processes.

Method used


Image

  • Price optimization system
  • Price optimization system
  • Price optimization system

Examples


Embodiment Construction

[0039]The present invention will now be described in detail with reference to a few preferred embodiments thereof as illustrated in the accompanying drawings. In the following description, numerous specific details are set forth in order to provide a thorough understanding of the present invention. It will be apparent, however, to one skilled in the art, that the present invention may be practiced without some or all of these specific details. In other instances, well known process steps and / or structures have not been described in detail in order to not unnecessarily obscure the present invention.

I. Overall System

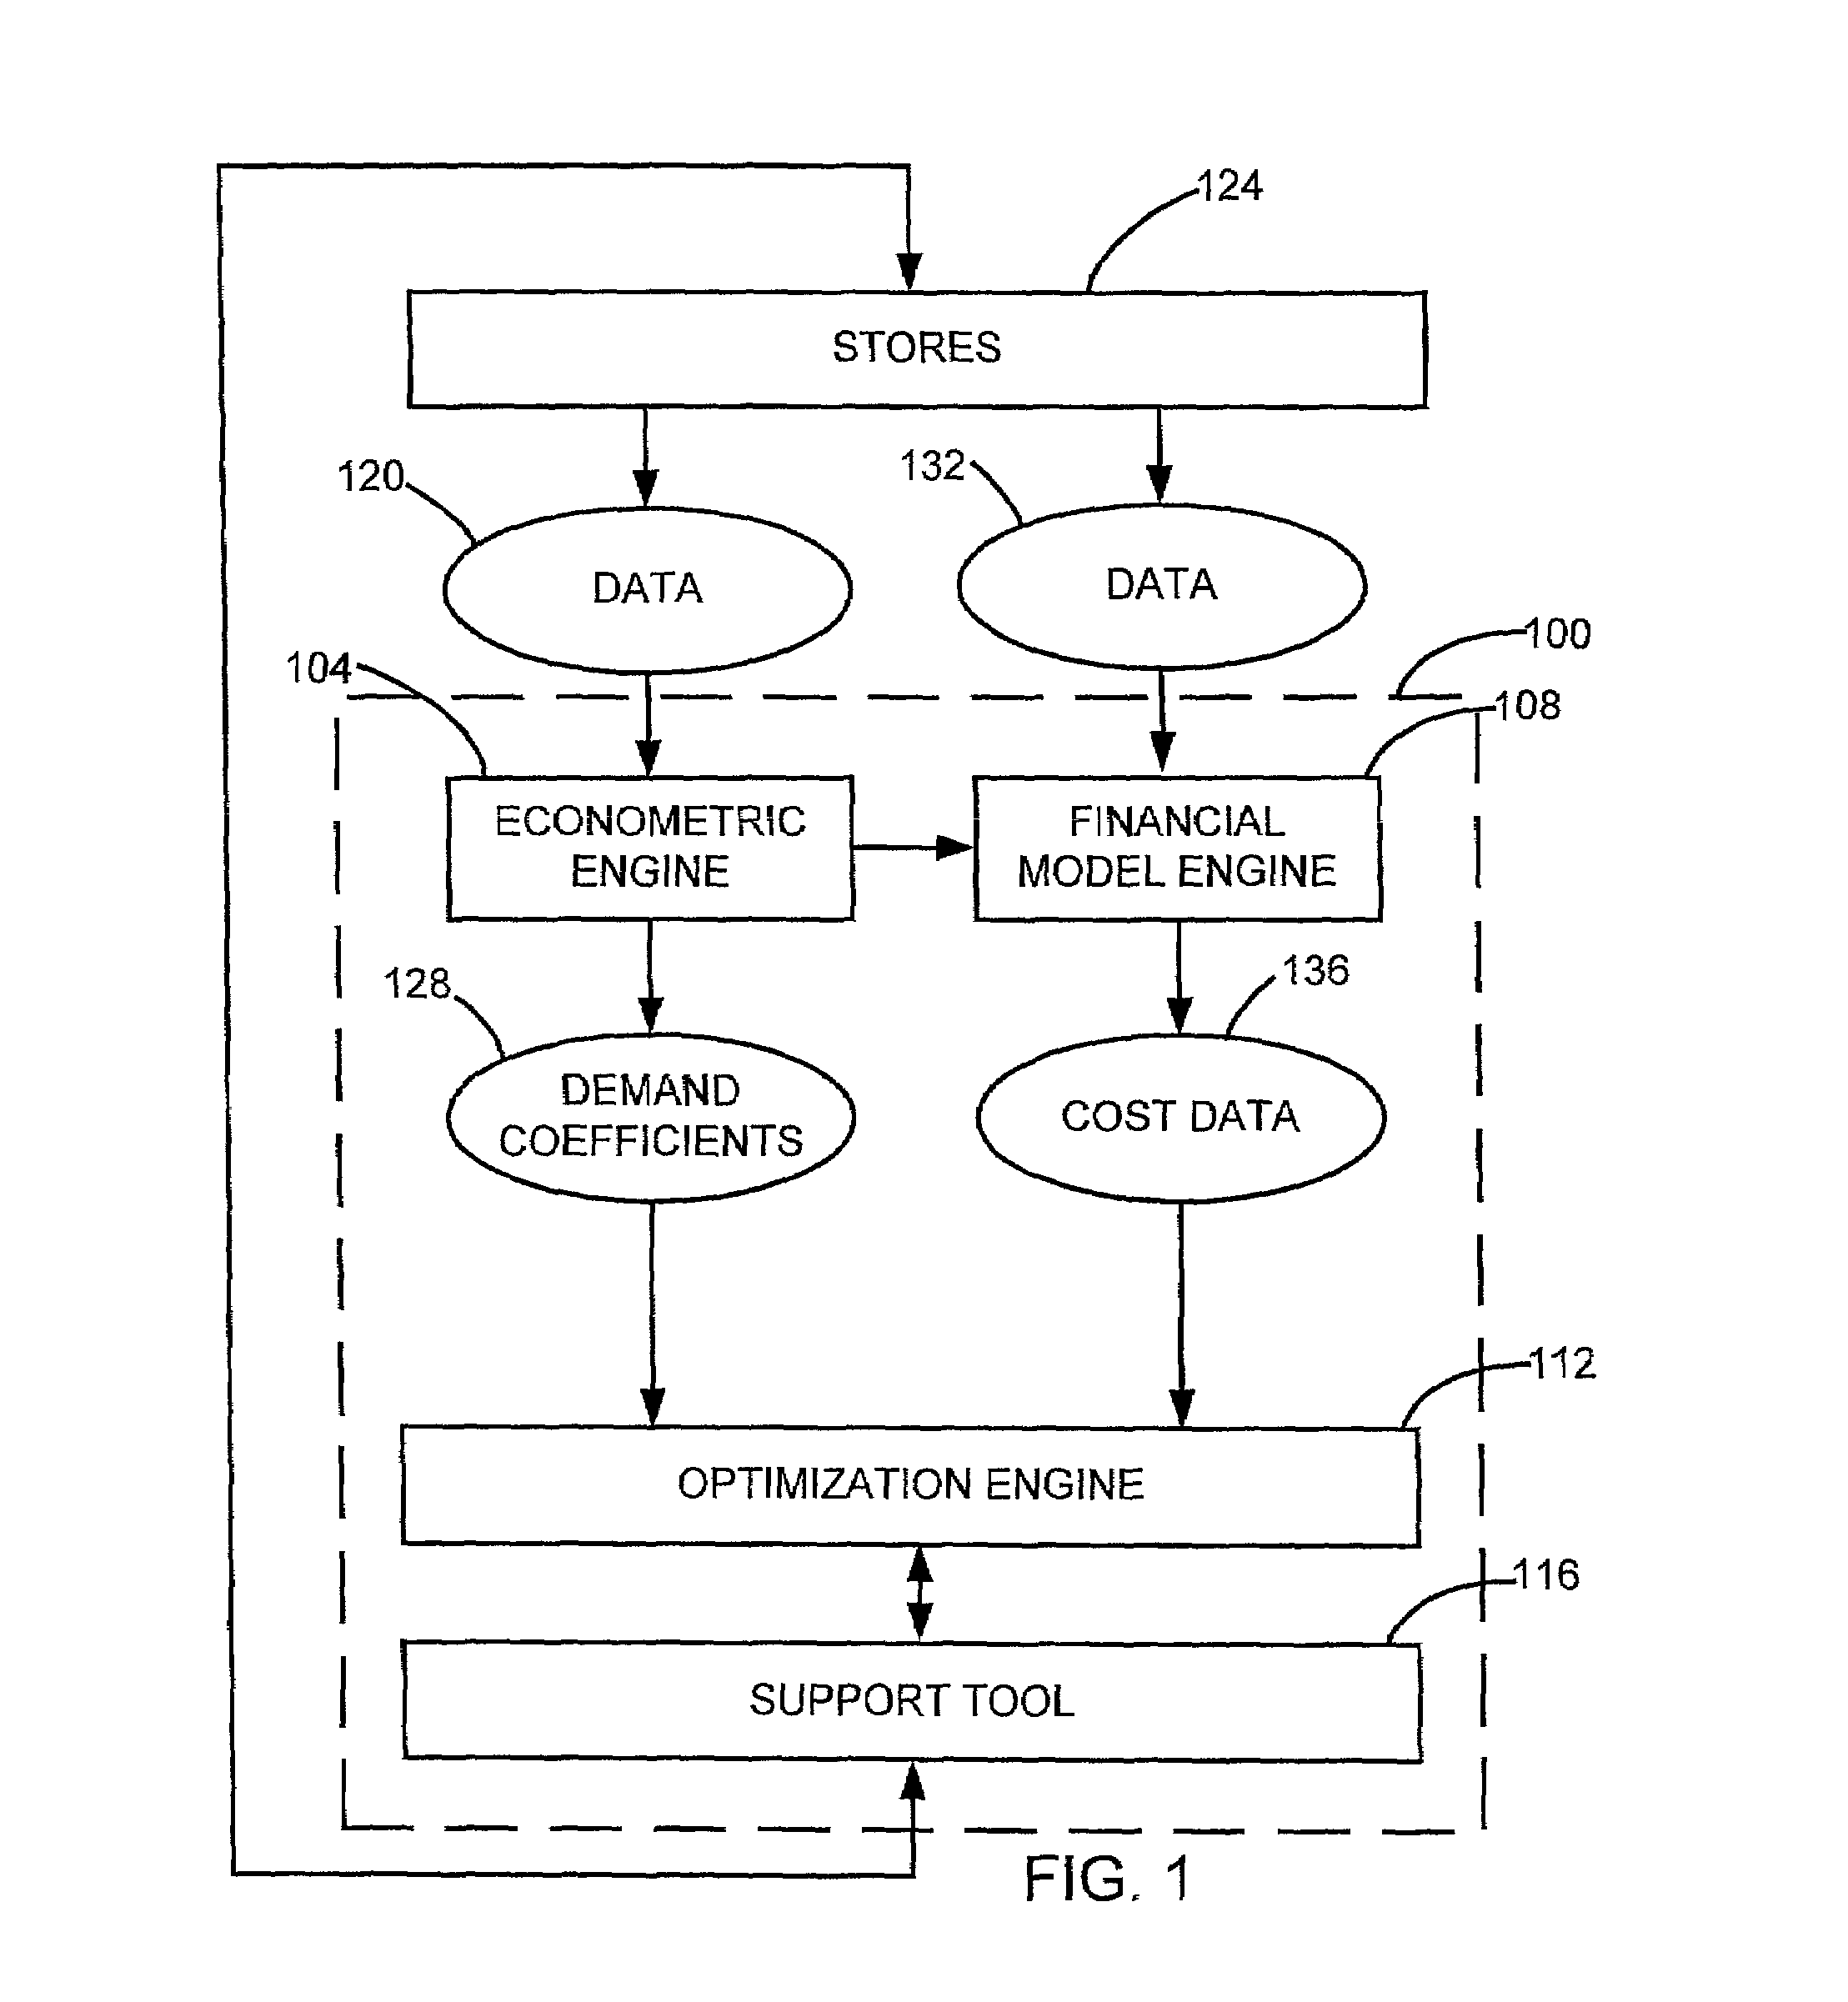
[0040]To facilitate discussion, FIG. 1 is a schematic view of a price optimizing system 100. The price optimizing system 100 comprises an econometric engine 104, a financial model engine 108, an optimization engine 112, and a support tool 116. The econometric engine 104 is connected to the optimization engine 112, so that the output of the econometric engine 104 is an inpu...


PUM


Abstract

A method for determining a preferred set of prices for a plurality of products is provided. Generally, a sales model is created. A cost model is also created. A preferred set of prices for the plurality of products based on the sales model and cost model is then generated.An apparatus for computing a preferred set of prices for a plurality of products is provided. An econometric engine for modeling sales as a function of price to create a sales model is provided. A financial model engine for modeling costs to create a cost model is provided. An optimization engine is coupled to the econometric engine and financial model engine to receive input from the econometric engine and financial model engine, wherein the optimization engine generates the preferred set of prices.

Description

CROSS-REFERENCE TO RELATED APPLICATIONS[0001]This application is related to co-pending and concurrently filed application Ser. No. 09 / 742,472, filed Dec. 20, 2000, entitled “Imputed Variable Generator”, by Suzanne Valentine, Krishna Venkatraman, Phil Delurgio, Michael Neal, and Hau Lee, which is incorporated by reference herein for all purposes.[0002]This application is related to co-pending and concurrently filed application Ser. No. 09 / 741,956, filed Dec. 20, 2000, entitled “Econometric Engine”, by Hau Lee, Suzanne Valentine, Michael Neal, Krishna Venkatraman, and Phil Delurgio, which is incorporated by reference herein for all purposes.[0003]This application is related to co-pending and concurrently filed application Ser. No. 09 / 741,957, filed Dec. 20, 2000, entitled “Financial Model Engine”, by Phil Delurgio, Suzanne Valentine, Michael Neal, Krishna Venkatraman, and Hau Lee, which is incorporated by reference herein for all purposes.[0004]This application is related to co-pendin...

Claims


Application Information

Patent Timeline
Patent Type & Authority Patents(United States)
IPC IPC(8): G06Q99/00
CPCG06Q30/0206G06Q30/0283G06Q30/06
Inventor NEAL, MICHAELVENKATRAMAN, KRISHNAVALENTINE, SUZANNEDELURGIO, PHILLEE, HAU
Owner INT BUSINESS MASCH CORP
Why Eureka
Try Eureka