Forecasting hotspots using predictive visual analytics approach

a visual analytics and forecasting technology, applied in the field of forecasting hotspots using predictive visual analytics, can solve the problems of inability to help analysts predict and deter such events, many of these analytic systems have been found to become intractable, and the data exploration and associated analytic capabilities offered by such systems are limited to reactive rather than proactive alerts

Inactive Publication Date: 2014-12-30
PURDUE RES FOUND INC
View PDF6 Cites 4 Cited by
  • Summary
  • Abstract
  • Description
  • Claims
  • Application Information

AI Technical Summary

Problems solved by technology

While this allows analysts to better respond to events and redistribute resources in an effort to minimize the effects of the events, these analytic systems are still unable to help analysts predict and deter such events.
Furthermore, many of these analytic systems have been found to become intractable as the data set grows.
Although these systems provide analysts with some means of monitoring events, data exploration and associated analytic capabilities offered by such systems are limited to reactive rather than proactive alerts.
These systems are additionally known to generate too many false positives for epidemiologists to analyze.

Method used


Image

  • Forecasting hotspots using predictive visual analytics approach
  • Forecasting hotspots using predictive visual analytics approach
  • Forecasting hotspots using predictive visual analytics approach

Examples


Embodiment Construction

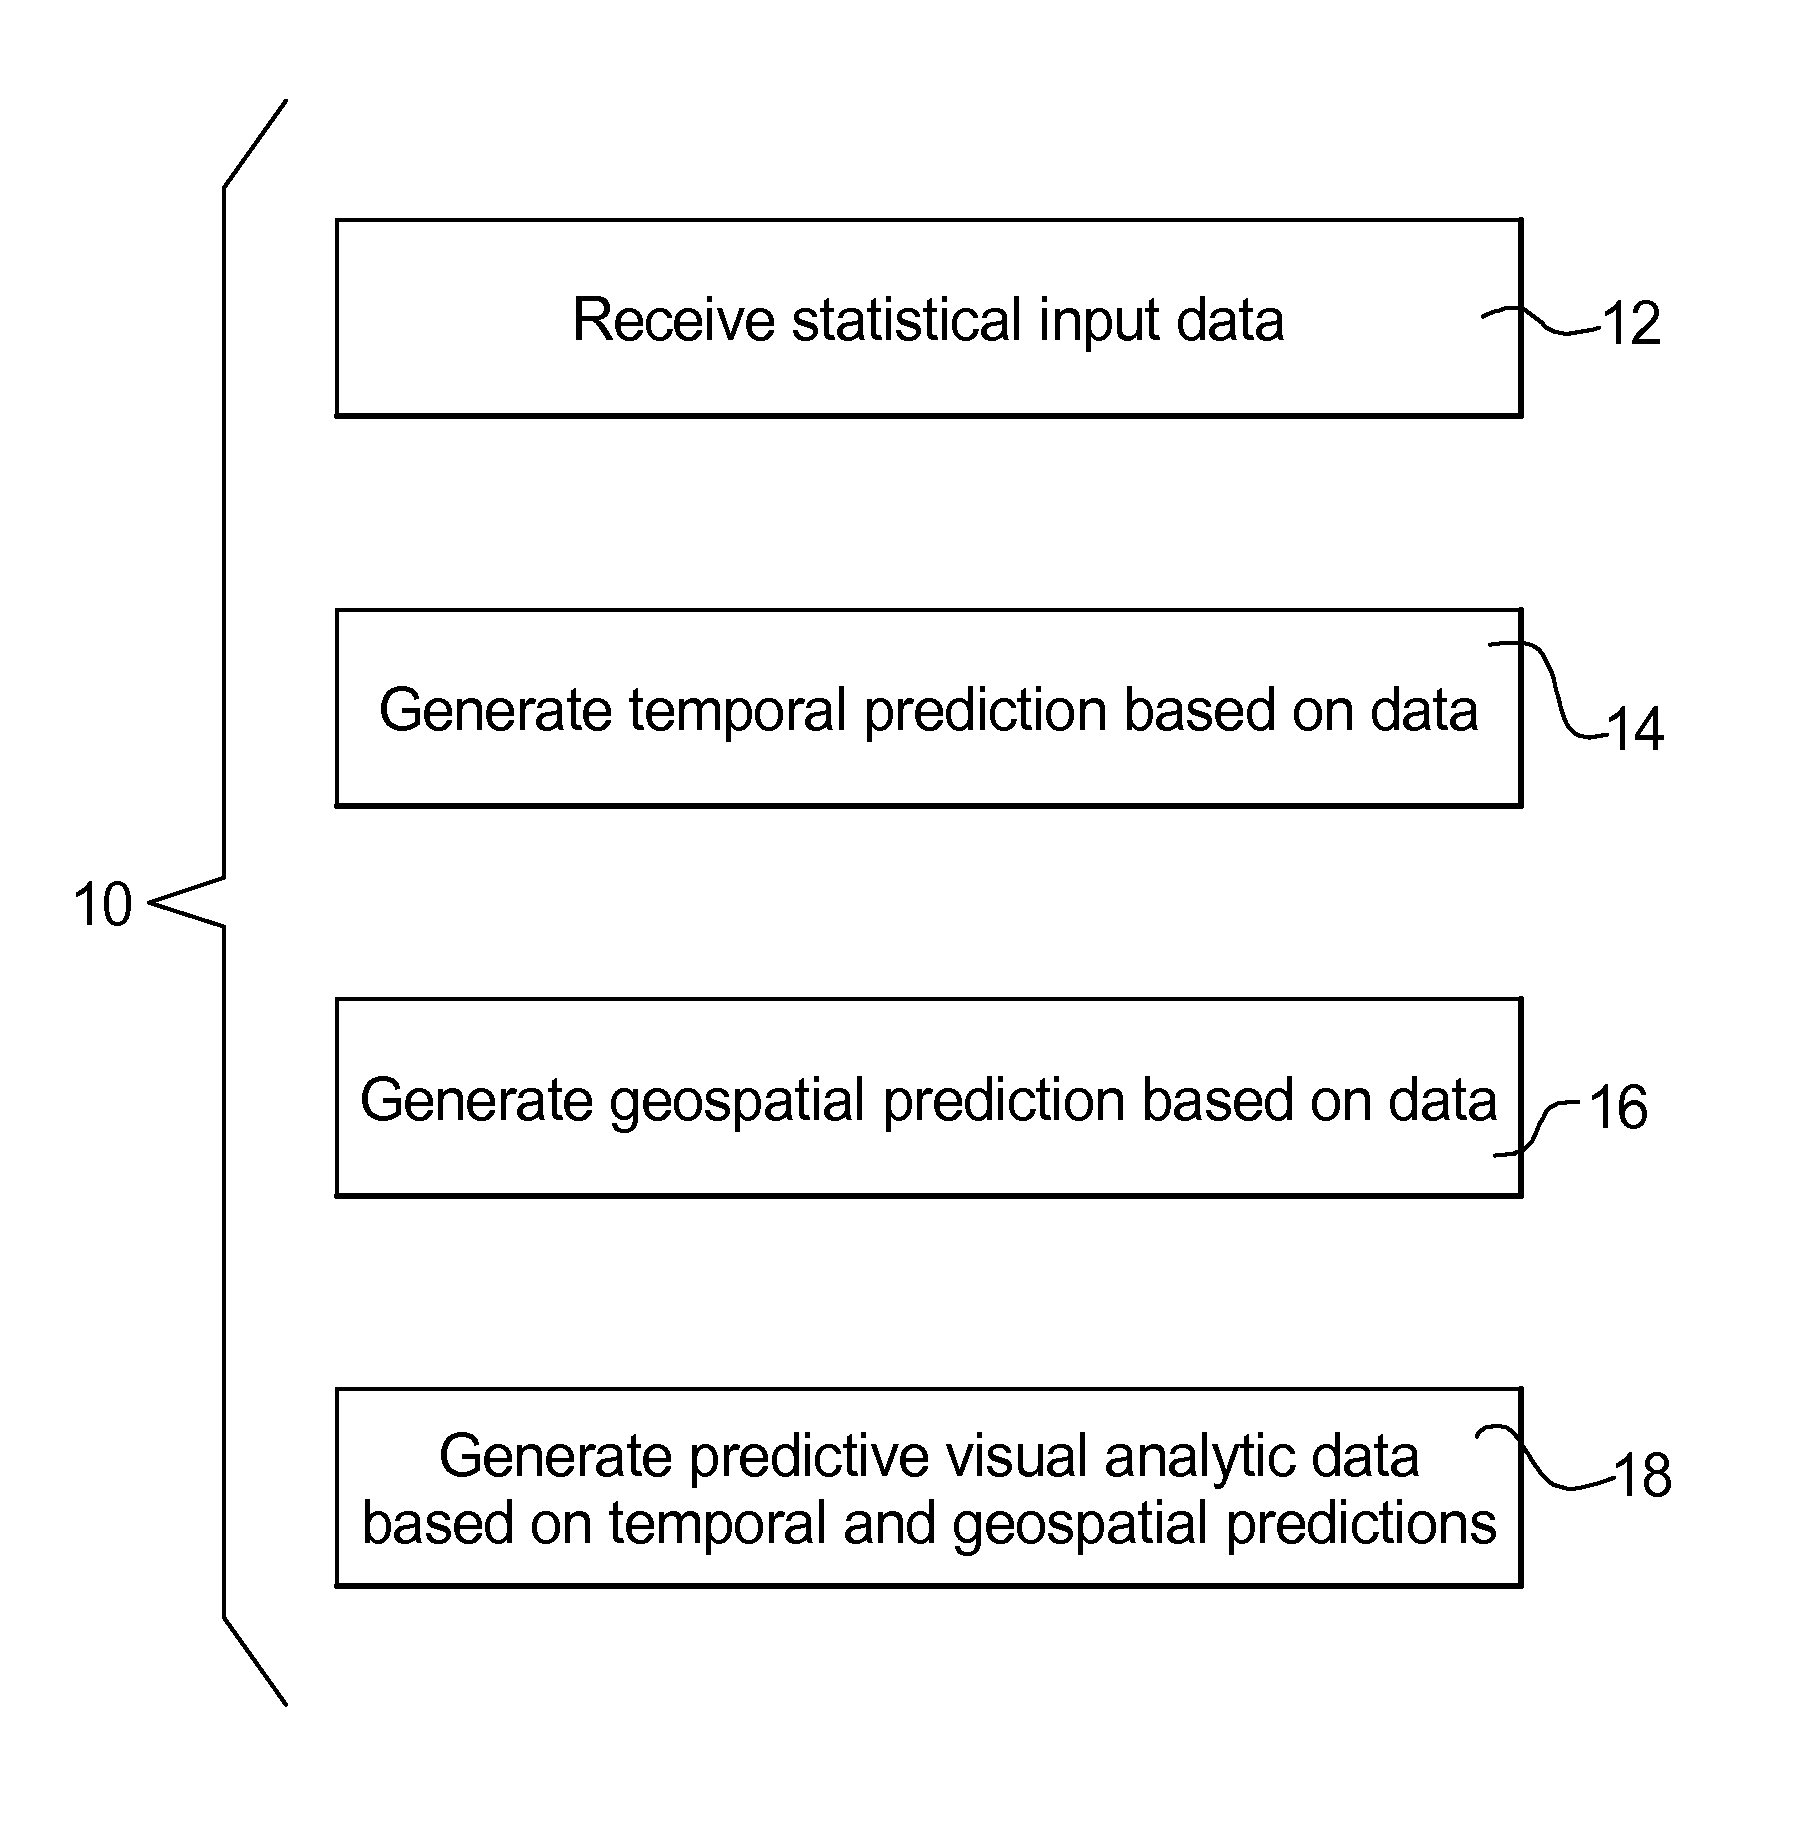
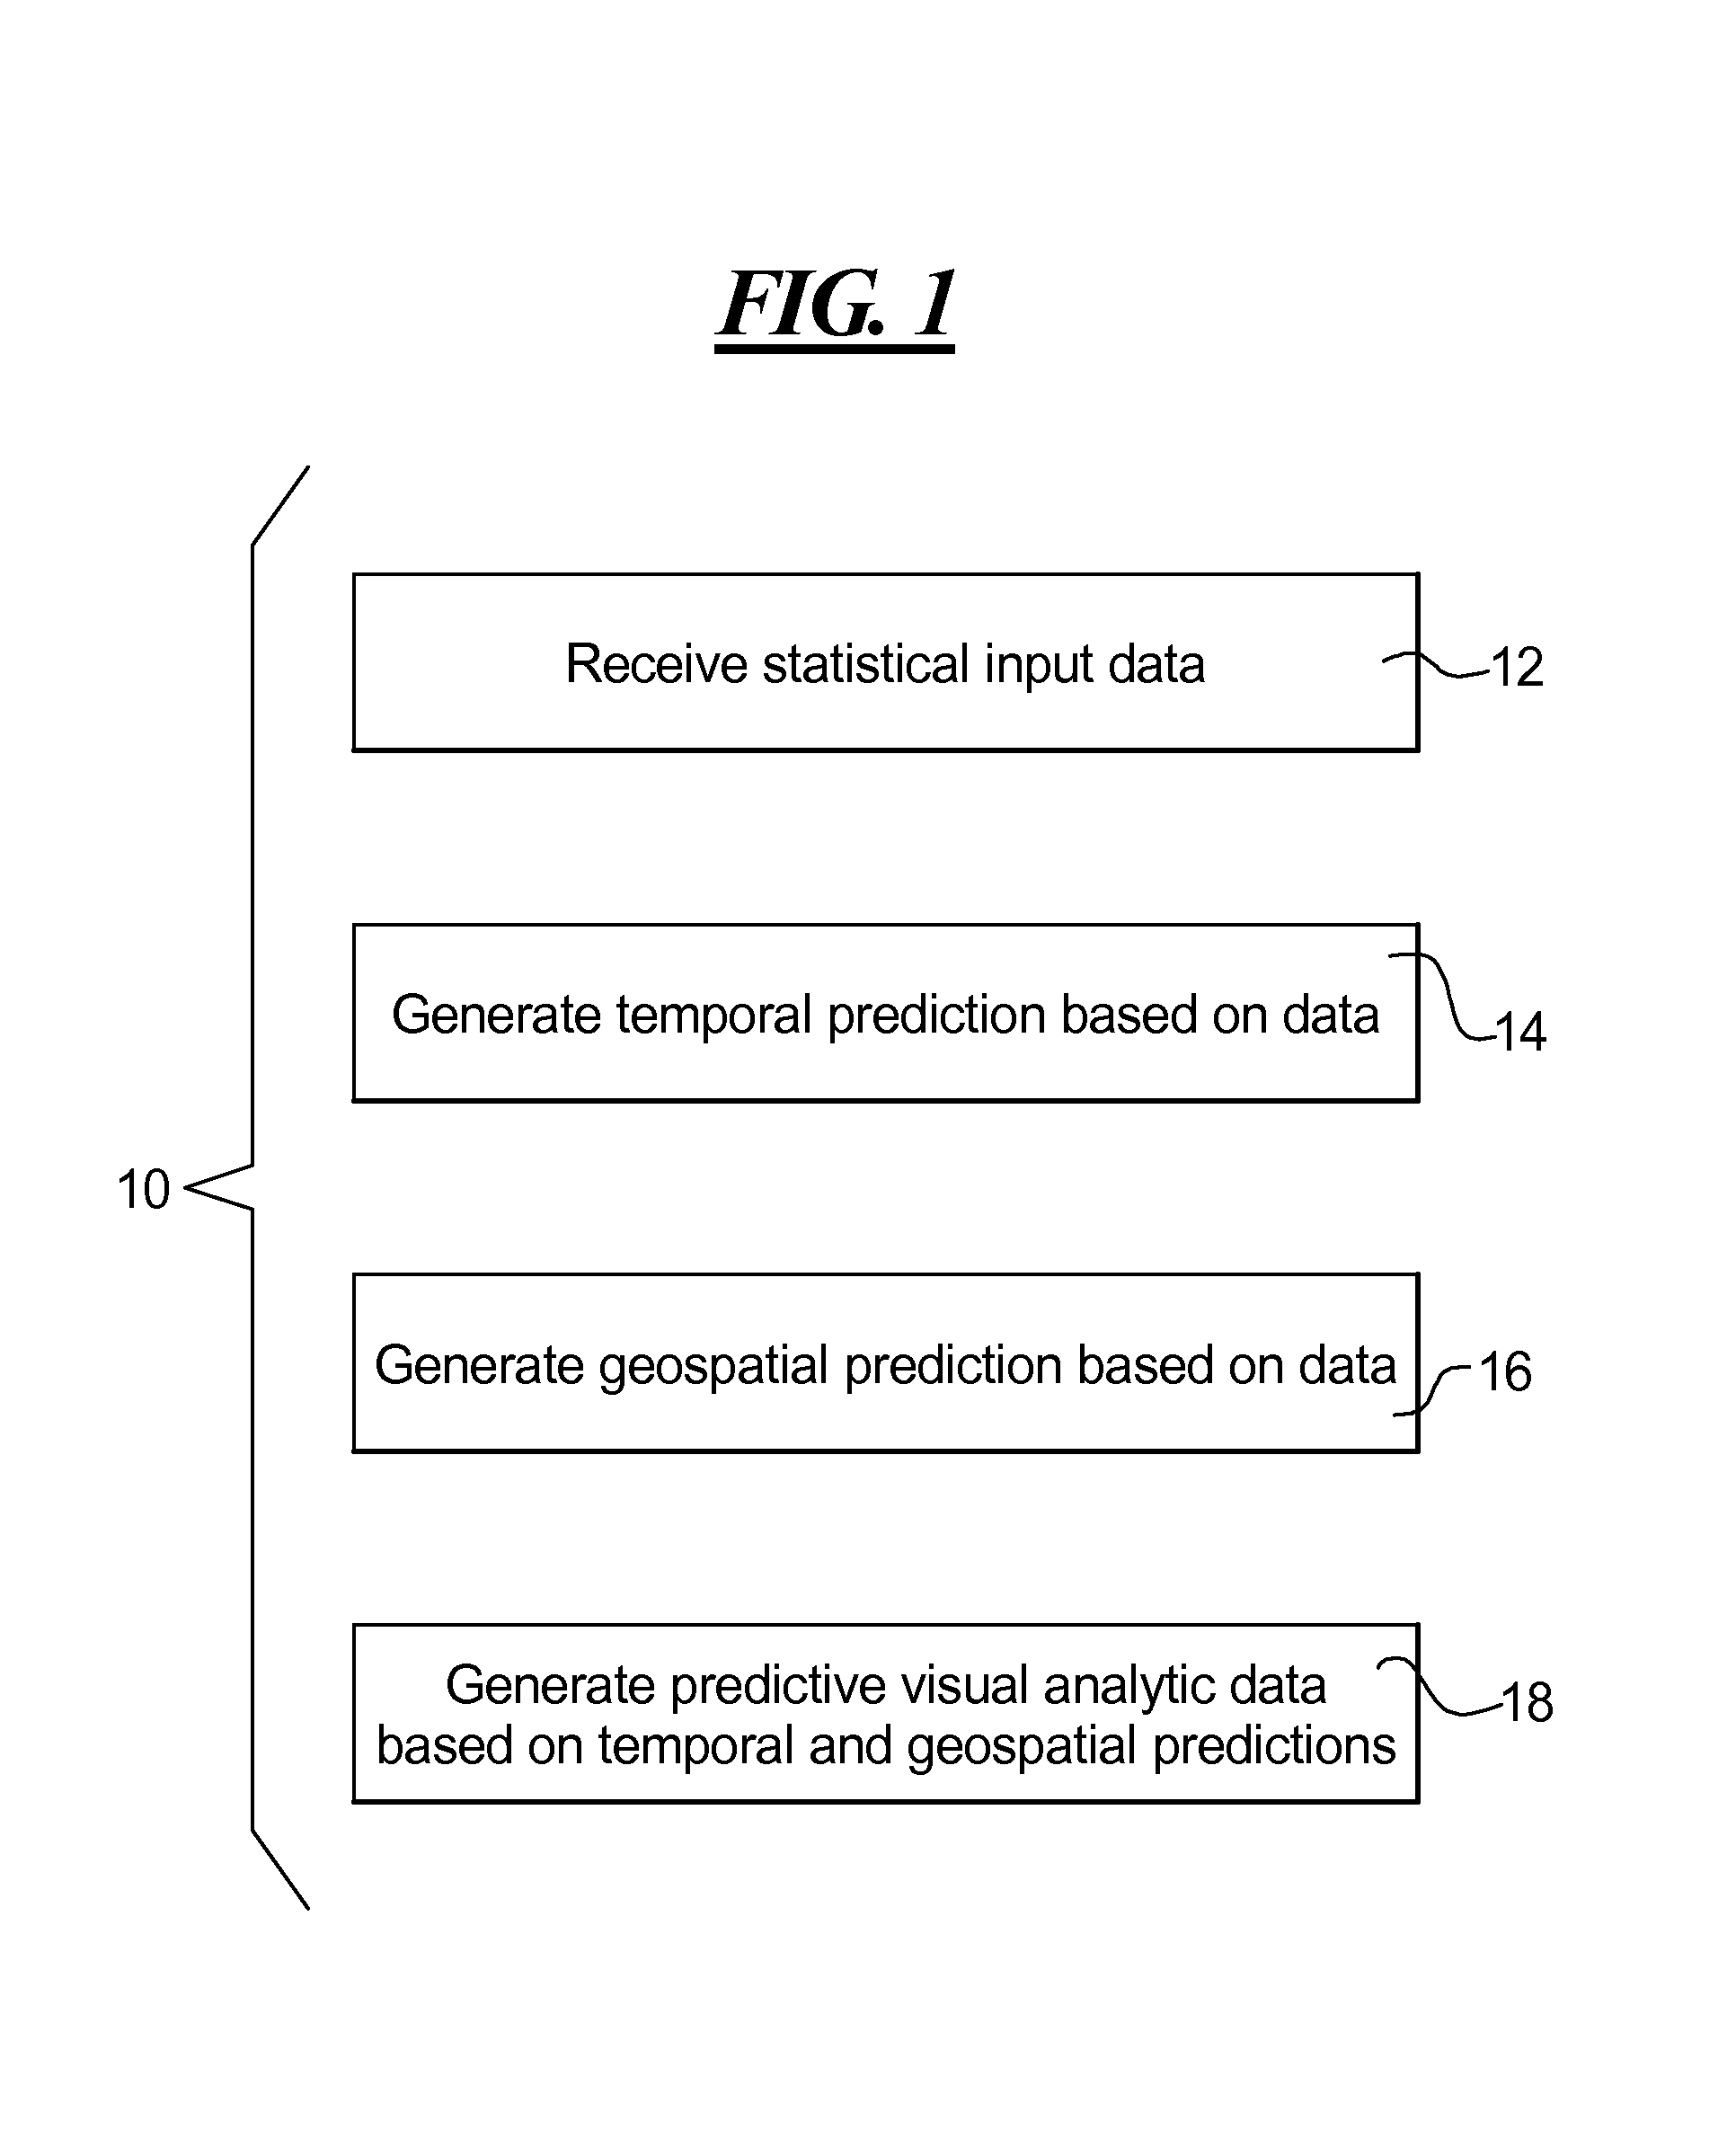
[0023]Turning first to FIG. 1, an exemplary method 10 that is configured to forecast hotspots, or regions of space and time with unusually high incidences of events, is disclosed. Moreover, the method 10 may be used provide advanced interactive visualization and analyses so as to link environments of geospatial data and time series graphs. Time series events may be forecast for a range of spatial aggregations to further provide a context in which to explore potential future events. Time series alerts may be generated for current and predicted event thresholds, by which analysts may be able to explore future event bounds for resource management and response scenarios. Alerts generated in the temporal realm may be quickly analyzed in the geospatiotemporal interface to help analysts find patterns in both the spatial and temporal domains simultaneously. Event distributions may be generated based on all events that are recorded with respect to any central data collection location, such a...


PUM


Abstract

A method for forecasting hotspots is provided. The method may include the steps of receiving input data at an input of the computational device, generating a temporal prediction based on the input data, generating a geospatial prediction based on the input data, and generating output data based on the time series and geospatial predictions. The output data may be configured to display at least one user interface at an output of the computational device.

Description

CROSS-REFERENCE TO RELATED APPLICATIONS[0001]This application is a U.S. National Stage filing under 35 USC §371 of International Patent Application No. PCT / US2010 / 036653 filed on May 28, 2010, which claims priority under 35 USC §119(e) to U.S. Provisional Application Ser. No. 61 / 182,164 filed on May 29, 2009.STATEMENT REGARDING FEDERALLY SPONSORED RESEARCH OR DEVELOPMENT[0002]This invention was made with government support under DE-AC05-76RL01830 awarded by Department of Energy. The government has certain rights in the invention.BACKGROUND[0003]1. Technical Field[0004]The present disclosure generally relates to predictive visual analytic tools, and more particularly, to systems and methods for generating predictive models of spatiotemporal events.[0005]2. Description of the Related Art[0006]Visual analytic systems are commonly used in the art to provide analysts with the ability to study trends in various data using interactive visual interfaces. Moreover, visual analytic systems al...

Claims


Application Information

Patent Timeline
Patent Type & Authority Patents(United States)
IPC IPC(8): G06Q10/10G06N5/02G06F17/18G06F17/00
CPCG06F17/18G06Q10/10
Inventor MACIEJEWSKI, ROSSHAFEN, RYANRUDOLPH, STEPHENCLEVELAND, WILLIAMEBERT, DAVID
Owner PURDUE RES FOUND INC
Why Eureka
Try Eureka