A Method for Extracting Traffic Flow Trend Based on Floating Car Data
A floating vehicle data and changing trend technology, applied in traffic flow detection, electrical digital data processing, special data processing applications, etc., can solve the problem that the changing trend of traffic flow cannot be completely distinguished and extracted, and the characteristics of traffic information expression are not considered, etc. question
- Summary
- Abstract
- Description
- Claims
- Application Information
AI Technical Summary
Problems solved by technology
Method used
Image
Examples
Embodiment 1
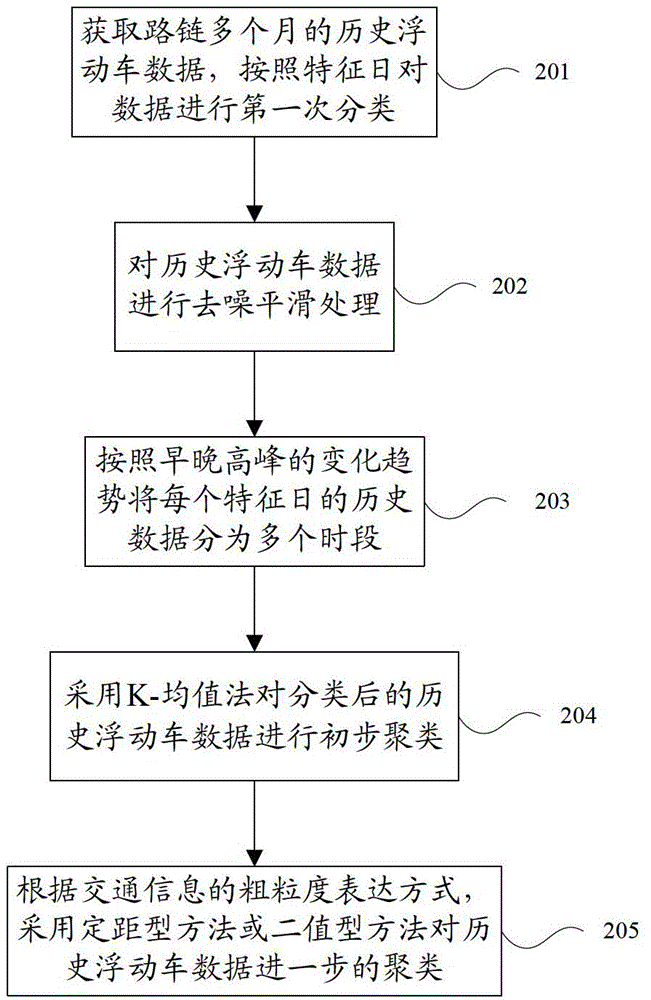
[0023] The flow of the traffic flow trend extraction method based on floating car data is as follows: figure 2 As shown, it specifically includes the following steps:
[0024] Step 201. Obtain the historical floating vehicle data of the road link for several months, and classify the data according to the characteristic date. A road segment is the basic spatial unit of traffic information expression. Taking the road segment as the basic processing object, the historical floating vehicle data of a certain road segment for several months (at least three months) is obtained. Divide the floating car data into eight characteristic days: Monday (Mon), Tuesday (Tue), Wednesday (Wed), Thursday (Thu), Friday (Fri), Saturday (Sat), Sunday (Sun), Holidays (Hol), use C to represent the set of characteristic days, then C={Mon,Tue,Wed,Thu,Fri,Sat,Sun,Hol}.
[0025] Step 202, performing denoising and smoothing processing on the historical floating car data. On a daily basis, denoise and s...
Embodiment 2
[0062] Take an auxiliary road of the North Fourth Ring Middle Road in Beijing as an example. This auxiliary road belongs to the secondary road of the city, and the road grade is 4. Carry out clustering on the data of floating cars on 12 Fridays from October to December 2011 (15:00~20:00 (period 180~240)) for 12 days in total, such as Figure 4 As shown, each pattern contains 61 cycles, that is, C=Fri, P=4, n=61. First use the K-means method to cluster the 12-day data into 6 categories, such as Figure 5 As shown, it can be seen that some patterns can be further combined. Then the distance type method and the binary type method are used for further combination. Related parameter values: α=5km / h, β=15kn / h.
[0063] According to the value of the given parameter, calculate when The weighting factor when : The conditions under which patterns can be combined are: d ^ = Σ i ...
PUM
 Abstract
Description
Claims
Application Information
 - R&D
- Intellectual Property
- Life Sciences
- Materials
- Tech Scout
- Unparalleled Data Quality
- Higher Quality Content
- 60% Fewer Hallucinations
Browse by: Latest US Patents, China's latest patents, Technical Efficacy Thesaurus, Application Domain, Technology Topic, Popular Technical Reports.
© 2025 PatSnap. All rights reserved.Legal|Privacy policy|Modern Slavery Act Transparency Statement|Sitemap|About US| Contact US: help@patsnap.com


