
Method and system for drawing density distribution diagram of bus routes

A technology of bus lines and density distribution, applied in the direction of drawing from basic elements, can solve problems such as inability to intuitively understand the number of bus lines, inconvenience, and inability for users to understand intuitively

Active Publication Date: 2015-08-26
XIAMEN GNSS DEV & APPL CO LTD
View PDF5 Cites 5 Cited by
  • Summary
  • Abstract
  • Description
  • Claims
  • Application Information

AI Technical Summary

Problems solved by technology

At present, different bus lines are generally displayed through broken lines of different colors. When multiple bus lines pass through the same street, the superposition of multiple bus lines forms a line segment. Users cannot intuitively understand how many bus lines this line segment represents, that is, they cannot It is inconvenient to intuitively understand the number of bus lines passing by this section of the street

Method used


Image

  • Method and system for drawing density distribution diagram of bus routes
  • Method and system for drawing density distribution diagram of bus routes
  • Method and system for drawing density distribution diagram of bus routes

Examples


Embodiment Construction

[0023] Below in conjunction with accompanying drawing and specific embodiment, the present invention will be further described:

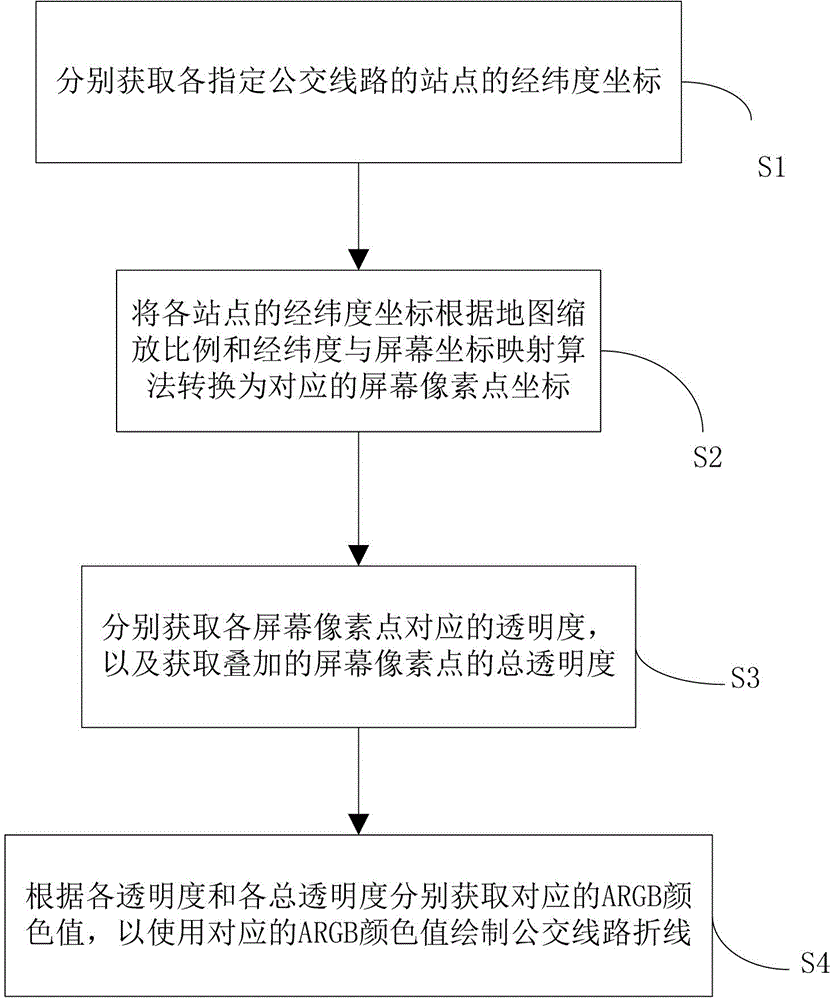
[0024] Please refer to 1, the present invention relates to a method for drawing a bus line density distribution map, and its preferred embodiment includes the following steps:

[0025] Step S1: Obtain the latitude and longitude coordinates of the route reference points of each designated bus line respectively.

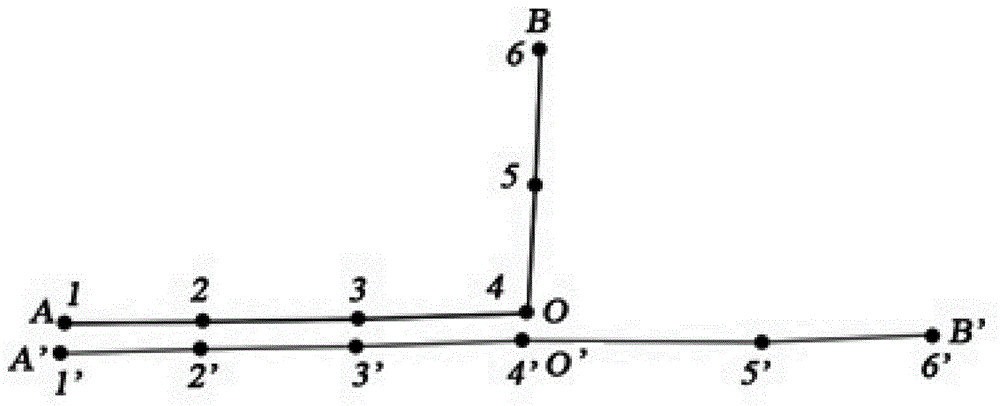
[0026] For example, if figure 2 As shown, the latitude and longitude coordinates of route reference points 1 to 6 and route reference points 1' to 6' are obtained respectively.

[0027] Step S2: converting the latitude and longitude coordinates of each route reference point into corresponding screen pixel coordinates according to the map scaling and the latitude and longitude and screen coordinate mapping algorithm;

[0028] Step S3: Obtain the transparency corresponding to each screen pixel, and obtain the total transparency of the super...


PUM


Abstract

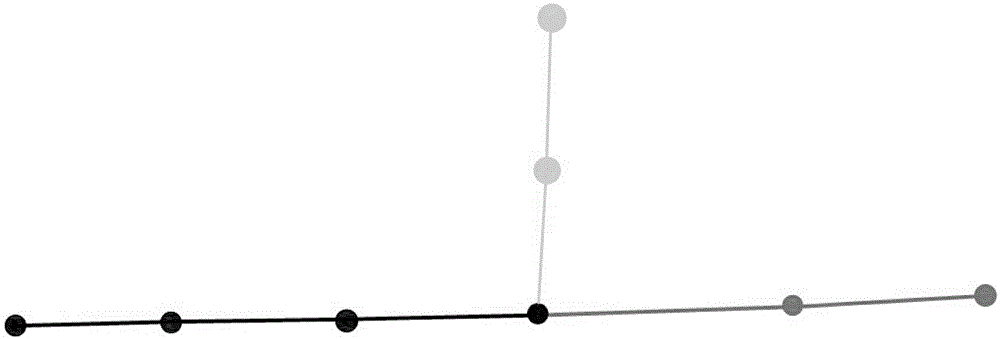
The present invention discloses a method and a system for drawing a density distribution diagram of bus routes. The method comprises the following steps: S1, respectively acquiring longitude coordinates and latitude coordinates of path reference points of each designated bus route; S2, transforming the longitude coordinates and the latitude coordinates of each path reference point into corresponding screen pixel point coordinates according to n algorithm for mapping between a zooming scale, a longitude and a latitude of a map and screen coordinates; S3, respectively acquiring transparency corresponding to each screen pixel point, and acquiring total transparency of the superimposed screen pixel points; and S4, respectively acquiring a corresponding ARGB (Alpha Red Green Blue) color value according to each transparency and each total transparency, so that broken lines of the bus routes are drawn through the corresponding ARGB color values. According to the method and the system, which are disclosed by the invention, the transparency is obtained to obtain the number of the bus routes, the broken lines are drawn by utilizing corresponding colors so as to realize accurate and visual display of a density distribution result of the bus routes on the map through color grading.

Description

technical field [0001] The invention relates to a method and system for drawing a bus line density distribution map. Background technique [0002] A bus route map is a city street map with detailed markings on bus routes, including station names, passing routes, route names, and bus route numbers, so that riders can quickly determine the easiest and fastest route for their own itinerary. At present, different bus lines are generally displayed through broken lines of different colors. When multiple bus lines pass through the same street, the superposition of multiple bus lines forms a line segment. Users cannot intuitively understand how many bus lines this line segment represents, that is, they cannot It is inconvenient to intuitively understand the number of bus lines passing by this section of the street. Contents of the invention [0003] Aiming at the deficiencies of the prior art, the purpose of the present invention is to provide a method and system for drawing a bu...

Claims


Application Information

Patent Timeline
IPC IPC(8): G06T11/20
Inventor 苏敏咸蔡明毅李文峰叶文菁王松辉
Owner XIAMEN GNSS DEV & APPL CO LTD
Learn More