Map technology-based data visualization system
A data and map technology, applied in the field of data processing, can solve the problems of inability to function, difficult to meet the requirements of user data display, and display the shortcomings of dimensional diversity, so as to meet the needs of multi-data detection, good promotion and application value, and enrich the detection dimension. Effect
- Summary
- Abstract
- Description
- Claims
- Application Information
AI Technical Summary
Problems solved by technology
Method used
Image
Examples
Embodiment
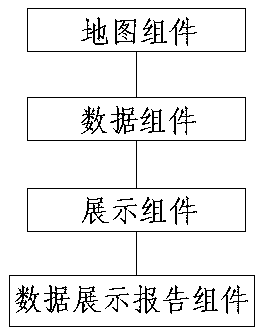
[0022] like figure 1 As shown, the data visualization system based on the map technology of the present invention includes a map component, a data component, a display component and a data display and report component.
[0023] The map component is used to componentize customized data visualization icons, with data calculation, data view, value range roaming and data integration functions. The map component enables the relationship between data and cities to be displayed in various forms, and data reports are made by displaying the results.
[0024] According to the different data formats, the data component uses different data display methods, and through the different fields corresponding to the data, according to the characteristics of each field, different data are visualized and displayed. For example, the field corresponding to the target data is the annual growth rate of the city's GDP data. Use a line chart to indicate the annual growth rate of GDP data, and place the...
PUM
 Abstract
Description
Claims
Application Information
 - R&D
- Intellectual Property
- Life Sciences
- Materials
- Tech Scout
- Unparalleled Data Quality
- Higher Quality Content
- 60% Fewer Hallucinations
Browse by: Latest US Patents, China's latest patents, Technical Efficacy Thesaurus, Application Domain, Technology Topic, Popular Technical Reports.
© 2025 PatSnap. All rights reserved.Legal|Privacy policy|Modern Slavery Act Transparency Statement|Sitemap|About US| Contact US: help@patsnap.com

