Data display method

A data display and data technology, applied in the field of communication, can solve the problems that the chart data cannot be linked and displayed, users cannot dig deep data value, and the relationship between data and data cannot be reflected.

Inactive Publication Date: 2020-01-07
MOCHITEC SHANGHAI CO LTD
View PDF8 Cites 0 Cited by
  • Summary
  • Abstract
  • Description
  • Claims
  • Application Information

AI Technical Summary

Problems solved by technology

[0002] In order to display the data graphically, each data displayed in the chart and the configuration of the corresponding chart and display form and content will be established during data processing; in the popular graphical report display tool, the chart is generated according to the preset form, and the data is passed The set data source is bound; when querying and displaying, the loaded data is combined and displayed in the form of a pre-set chart, and because the data type and quantity are usually large, the performance requirements are diverse, and there are many types of charts, complex reports and charts are generated. The display of personalized icon reports is not flexible enough; and the linkage display between charts and data cannot be displayed, the relationship between data and data cannot be reflected, and users cannot effectively dig out the deep data value from the charts and do corresponding predict

Method used


Image

  • Data display method
  • Data display method
  • Data display method

Examples


Embodiment Construction

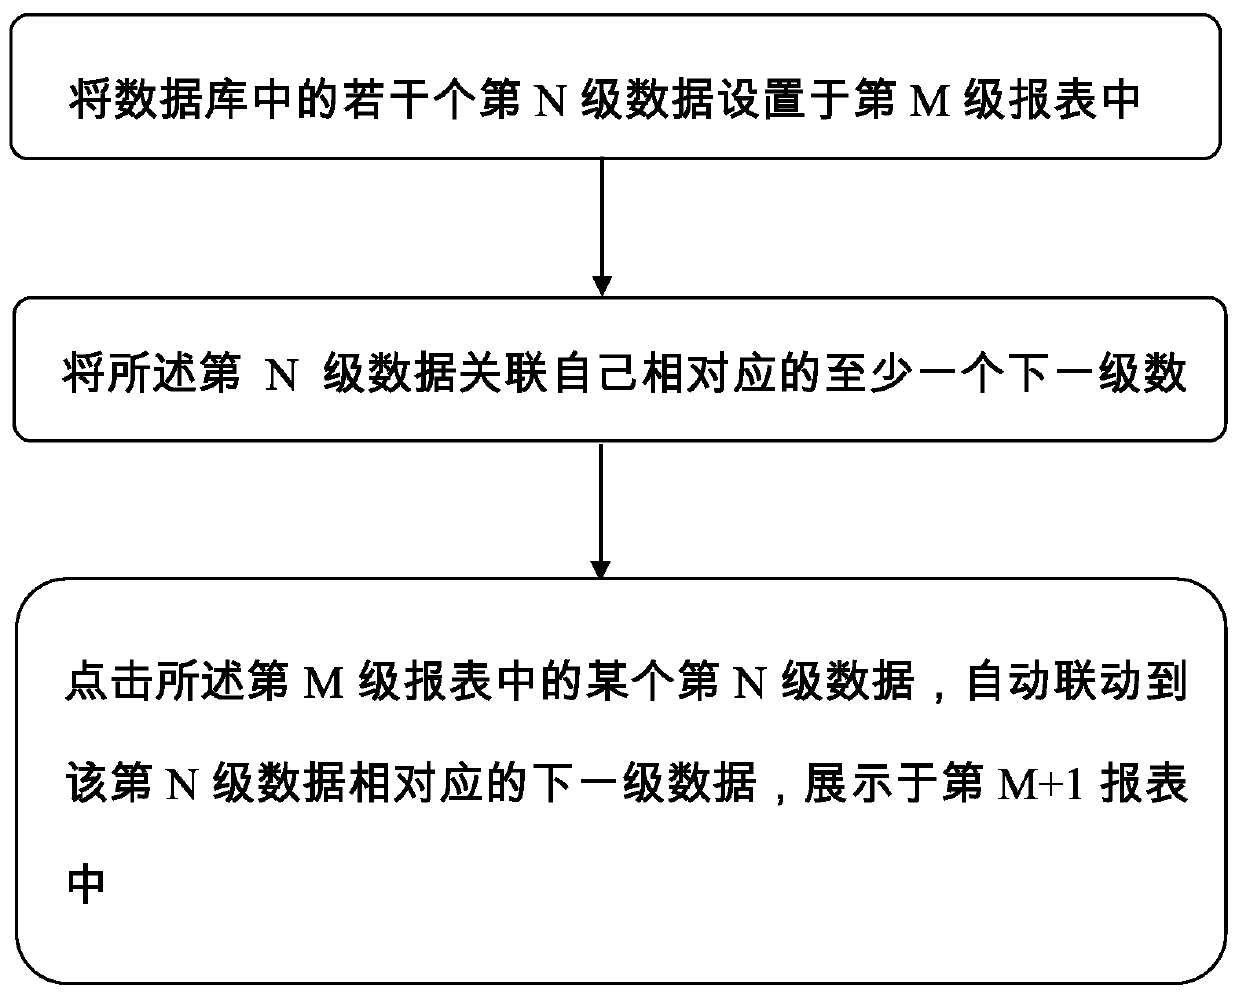
[0021] In order to more clearly illustrate the embodiments of the present invention or the technical solutions in the prior art, the specific implementation manners of the present invention will be described below with reference to the accompanying drawings. Obviously, the accompanying drawings in the following description are only some embodiments of the present invention, and those skilled in the art can obtain other accompanying drawings based on these drawings and obtain other implementations.

[0022] In order to make the drawing concise, each drawing only schematically shows the parts related to the present invention, and they do not represent the actual structure of the product. In addition, to make the drawings concise and easy to understand, in some drawings, only one of the components having the same structure or function is schematically shown, or only one of them is marked. Herein, "a" not only means "only one", but also means "more than one".

[0023] Such as f...


PUM


Abstract

The invention provides a data display method. The method comprises the following steps: setting a plurality of Nth-level data in a database in an Mth-level report; wherein N and M are integers greaterthan 1 and equal to 1 respectively; associating the Nth-level data with at least one next-level data corresponding to the Nth-level data; and clicking certain Nth-level data in the Mth-level report,automatically linking to the next-level data corresponding to the Nth-level data, and displaying in the (M + 1) th report. According to the method, data linkage can be realized on the same page, and different reports do not need to be generated by returning to a database and reselecting data.

Description

technical field [0001] The invention relates to the technical field of communication, in particular to a data display method. Background technique [0002] In order to display the data graphically, each data displayed in the chart and the configuration of the corresponding chart and display form and content will be established during data processing; in the popular graphical report display tool, the chart is generated according to the preset form, and the data is passed The set data source is bound; when querying and displaying, the loaded data is combined and displayed in the form of a pre-set chart, and because the data type and quantity are usually large, the performance requirements are diverse, and there are many types of charts, complex reports and charts are generated. The display of personalized icon reports is not flexible enough; and the linkage display between charts and data cannot be displayed, the relationship between data and data cannot be reflected, and user...

Claims


Application Information

Patent Timeline
Patent Type & Authority Applications(China)
IPC IPC(8): G06F16/26
CPCG06F16/26
Inventor 张威李金鹏齐洋
Owner MOCHITEC SHANGHAI CO LTD
Why Eureka
Try Eureka