Knowledge graph visual editing and persistence implementation method and system architecture

A technology of knowledge graph and implementation method, which is applied in the fields of knowledge graph visual editing and persistence implementation methods and system architecture, which can solve problems such as unfavorable mining, high threshold for editing knowledge, and unfriendliness, and achieve the effect of convenient storage and efficient communication

Pending Publication Date: 2020-06-26
HOHAI UNIV
View PDF2 Cites 19 Cited by
  • Summary
  • Abstract
  • Description
  • Claims
  • Application Information

AI Technical Summary

Benefits of technology

This patented method allows people who are working on an associated network or system to see how they have explained their relationships by showing them visually through graphs instead of just looking up each other's names. It also helps guide researchers into different ways that may help improve understanding about complex systems like social networks.

Problems solved by technology

This patents discusses how understanding concepts like things or data becomes increasingly complicated due to their intricate connections within them. To solve these issues, there have developed various technical means such as annotation maps (also called content management systems), relational databases, web minification tools, etc., but they still lack flexibility when used alone because each new problem addressed requires developing a separate representation tool for better comprehension on what happened during training. Additionally, current methods require rendering static representations only temporarily while learning through experience rather than making dynamic ones overtime.

Method used


Image

  • Knowledge graph visual editing and persistence implementation method and system architecture
  • Knowledge graph visual editing and persistence implementation method and system architecture
  • Knowledge graph visual editing and persistence implementation method and system architecture

Examples


Embodiment 1

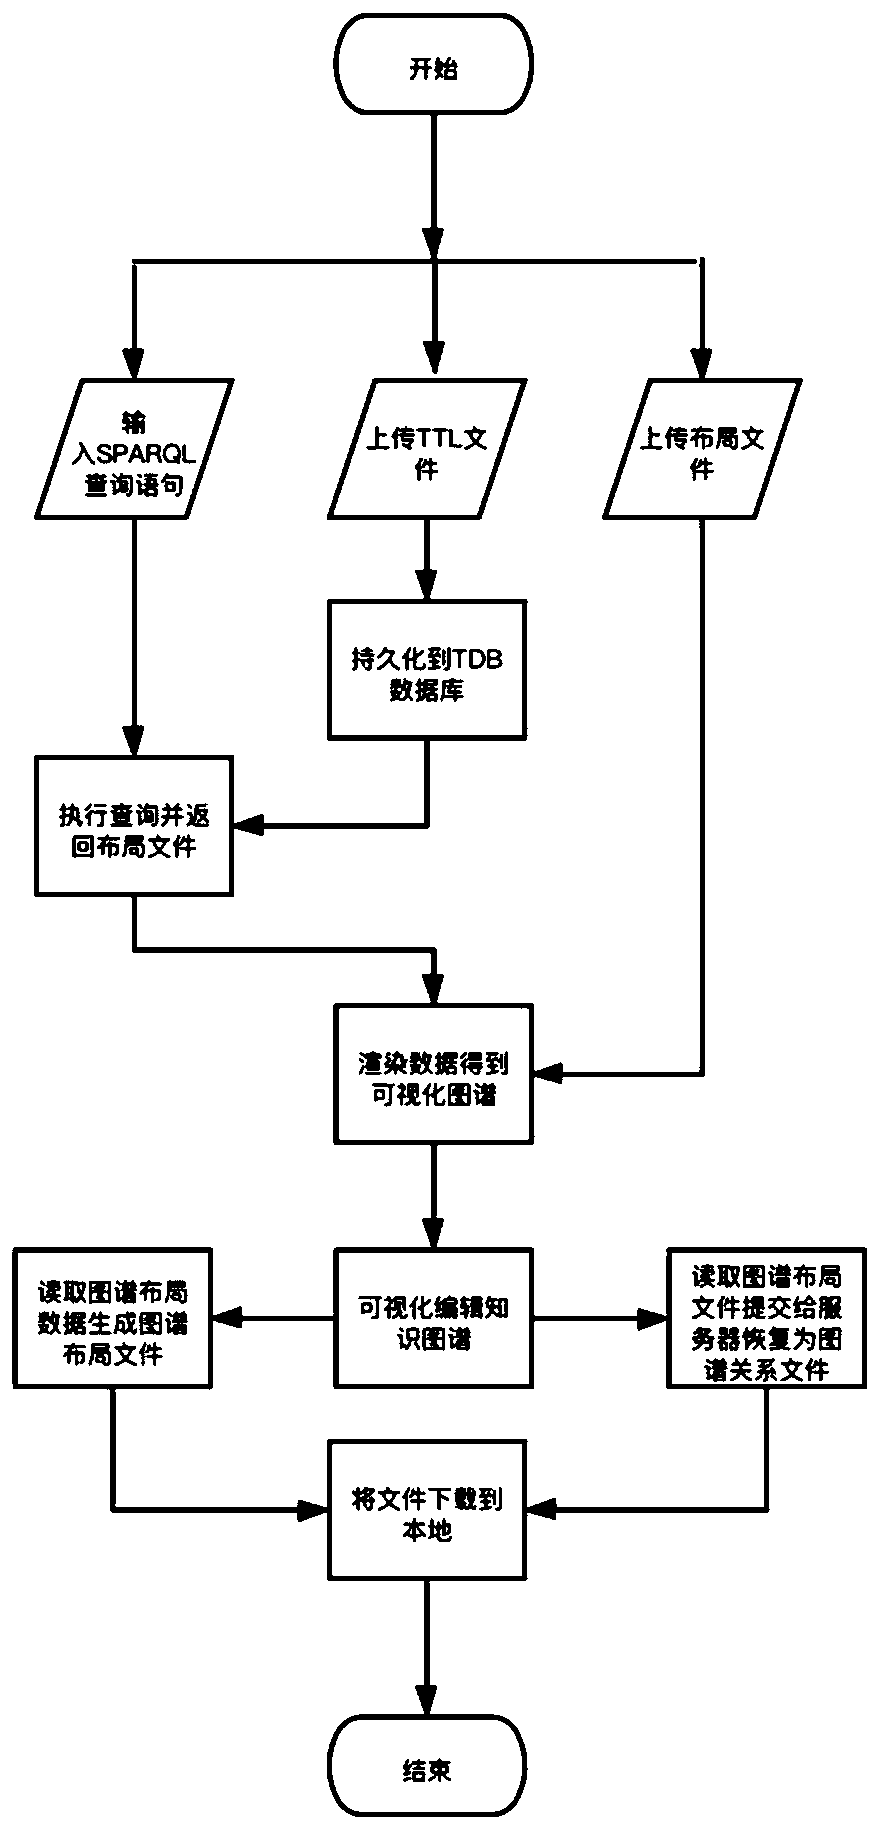
[0096] Embodiment 1 describes the process of visually presenting SPARQL query results.

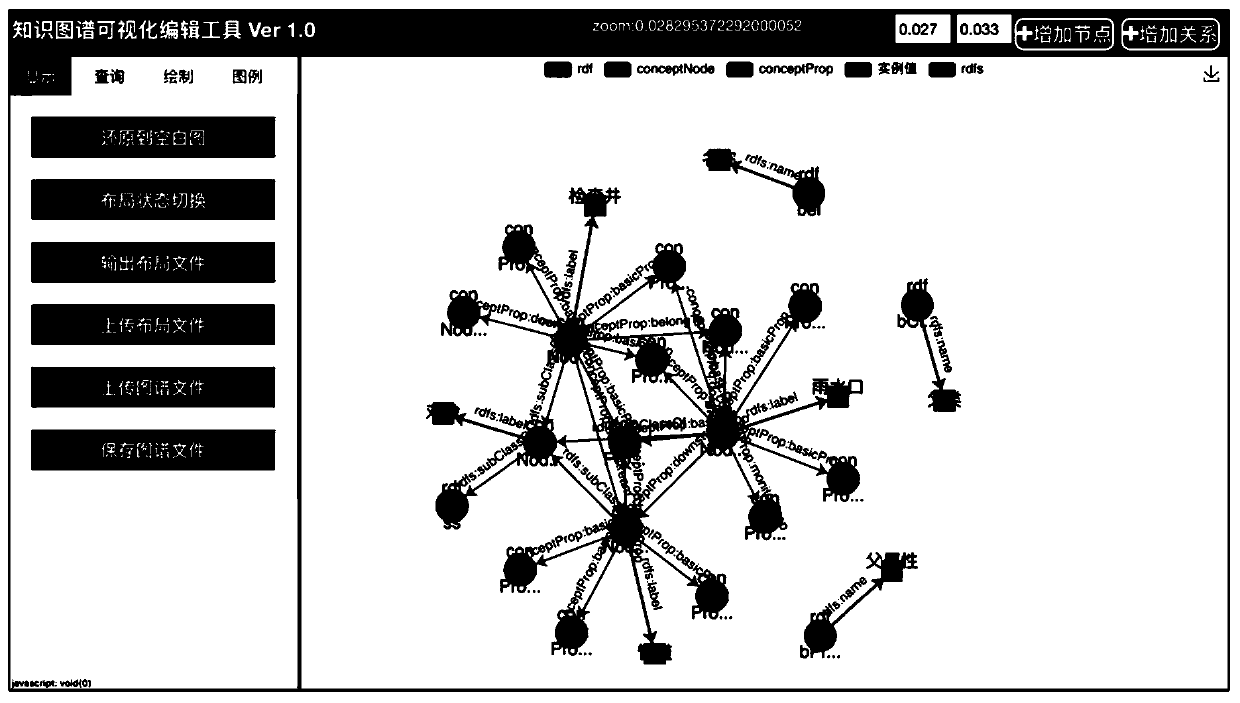
[0097] When the user visits the front-end page, the browser automatically requests the default SPARQL query, and the visualized result is displayed on the right after the server completes the execution and returns the result.

[0098] Users can customize the SPARQL query statement under the "Query" sub-function in the operation area on the left. After clicking Submit, wait for the server to execute and return the result, and display the visualized result on the right. For the rendered visual map, the user can zoom in and out through the scroll wheel, and the zoom ratio will be displayed in the upper right corner in real time. When the zoom ratio is within the set trigger range, the instance layer and concept layer maps will be shrunk / decomposed.

Embodiment 2

[0100] Embodiment 2 describes the process of obtaining the visualization result after the user uploads the TTL file and obtaining the TTL file from the visualization result.

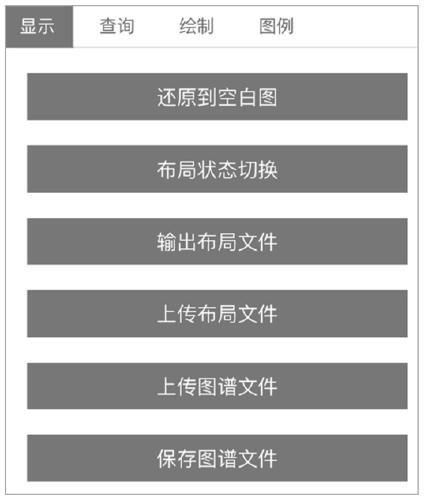
[0101] The user clicks "Upload Map File" under the "Display" sub-function in the operation area on the left, and fills in the specified TDB database model name. The server persists the data to the TDB database according to the instructions and automatically executes the SPARQL query, and the returned results are displayed in the visualization area on the right.

[0102] After the user has obtained the visualized knowledge graph, the user clicks "Save Graph File" under the "Display" sub-function in the left operation area, and the browser will submit the current layout data to the server, and the server will use the node id , name data and the source, target and model data of the directed edge, combined with the "namespace" data in the specified model to construct a TTL file and return it to the user.

Embodiment 3

[0104] Embodiment 3 describes the mutual conversion process between the layout file and the visual knowledge map.

[0105] After the user has obtained the visualized knowledge graph, the user clicks "Output Layout File" under the "Display" subfunction in the operation area on the left, and the browser will download the layout file of the graph in the current display area to the local for the user.

[0106] Users can click "Upload Layout File" under the "Display" sub-function in the operation area on the left to send the locally stored layout file data to the browser to complete the map visualization, and the visualization results will be automatically presented in the display area on the right.


PUM


Abstract

The invention discloses a knowledge graph visual editing and persistence implementation method and system architecture. According to the method, persistence of a knowledge graph editing result is allowed to be achieved based on a specific visual knowledge graph layout file, SPARQL query and visual interactive editing are supported, and the editing result can be persisted into a universal knowledgegraph file or a visual graph layout file defined by the invention. The system architecture mainly comprises a foreground visualization map interaction module and a background map database managementmodule. According to the method, the semantic relationship between entities described in a structured manner in the knowledge graph is visually expressed by using a visualization technology; Meanwhile, the layout file of the visual knowledge graph is defined, so that a user can conveniently store and recover a visual result. According to the invention, support can be provided for realizing efficient communication and intuitive display in related work of the knowledge graph.

Description


Claims


Application Information

Patent Timeline
Owner HOHAI UNIV
Why Eureka
Try Eureka