A method to improve the signal-to-noise ratio of lc-ms data

A LC-MS, signal-to-noise ratio technology, applied in the field of chromatography, can solve problems such as unfavorable analysis, signal distortion, signal peak response reduction, etc., to avoid difficulties in selecting threshold coefficients, improve signal-to-noise ratio, and good denoising effect. Effect

Active Publication Date: 2022-06-07
HANGZHOU PUYU TECH DEV CO LTD +1
View PDF10 Cites 0 Cited by
  • Summary
  • Abstract
  • Description
  • Claims
  • Application Information

AI Technical Summary

Problems solved by technology

[0004] 1. Fourier filtering method, the Fourier filtering method has insufficient processing ability for non-stationary signals and cannot obtain the moment when each frequency appears
[0005] 2. The wavelet denoising method can deal with non-stationary signals, but it is difficult to select the threshold parameter of wavelet transform
[0006] 3. The polynomial smoothing algorithm is also called the SG filter method, which weights the data in the window and can smooth the noise, but it is not adaptive
[0007] In addition, the above algorithms all process the entire spectral line at the same time, which may cause signal distortion while filtering out noise
[0008] The signal of LC-MS data has the characteristics of local mutation. When the traditional denoising algorithm is used for processing, the tip of the signal is often removed while removing the noise, thereby reducing the response of the signal peak, which is very unfavorable for subsequent Analysis

Method used


Image

  • A method to improve the signal-to-noise ratio of lc-ms data
  • A method to improve the signal-to-noise ratio of lc-ms data
  • A method to improve the signal-to-noise ratio of lc-ms data

Examples


Embodiment 1

[0034] A schematic structural diagram of a method for improving the signal-to-noise ratio of LC-MS data according to an embodiment of the present invention, and the method for improving the signal-to-noise ratio of LC-MS data includes the steps:

[0035] (A1) Detect the peak position p and width w of the chromatographic peak s(t), and obtain the starting position w of the chromatographic peak s(t) 1 and end position w 2 ;

[0036] (A2) Divide the chromatographic peak s(t) into peak parts s 1 (t) and the off-peak part s 2 (t), enter step (B1) and step (C1) respectively;

[0037] (B1) Design a basis function according to the chromatographic peak s(t), the basis function is represented as F by discretization, and four orthogonal filters of length L are formed according to F; L·D, H·D and L· R, H·R, L·R is the normalized representation of F, H·R is the orthogonal inverse filter of L·R, L·D is the reverse of L·R, and H·D is the inverse of H·R reverse;

[0038] (B2) get the pe...

Embodiment 2

[0058] An application example of the method for improving the signal-to-noise ratio of LC-MS data according to Embodiment 1 of the present invention in the detection of pesticide residues.

[0059] In this application example, the method for improving the signal-to-noise ratio of LC-MS data includes the steps:

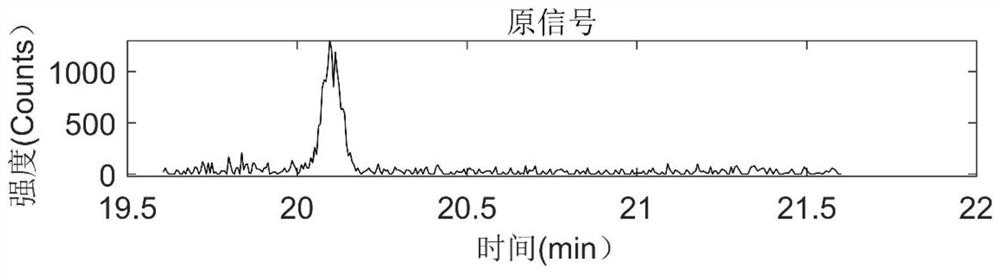
[0060] (A1) Obtain the chromatographic peak s(t), such as figure 1 As shown, the peak position p and width w of the chromatographic peak s(t) are detected, and the starting position w of the chromatographic peak s(t) is obtained 1 and end position w 2 ;

[0061] The way to obtain the peak position p is:

[0062] as a function Perform continuous wavelet transform on the chromatographic peak s(t) for the mother wavelet, and detect the maximum value in the wavelet coefficient matrix, which corresponds to the peak position p of the chromatographic peak s(t);

[0063] The way to obtain the width w of the chromatographic peak s(t) is:

[0064] as a function Obtain t...


PUM


Abstract

The present invention provides a method for improving the signal-to-noise ratio of LC-MS data, comprising the steps of: (A1) obtaining the start position and end position of the chromatographic peak; (A2) dividing the peak into a peak part and a non-peak part, respectively entering step (B1) ‑(B6) and step (C1)‑(C2); (B1) According to the design basis function; (B2) the first-level approximation coefficient and the first-level detail coefficient; (B3) the multi-level approximation coefficient and each Layer detail coefficient; (B4) obtained approximate part and detail part; perform EMD empirical mode decomposition; (B5) calculate the energy value of each modal component; (B6) obtain the peak part information after denoising; (C1) Approximate fractions obtained in the manner of steps (B1)‑(B4); (C2) Integrate and approximate fractions to obtain denoised chromatographic peaks. The invention has the advantages of good denoising effect and the like.

Description

technical field [0001] The present invention relates to chromatography, in particular to a method for improving the signal-to-noise ratio of LC-MS data. Background technique [0002] Liquid chromatography-mass spectrometry (LC-MS) is an important tool for qualitative analysis of complex mixture samples. It combines the advantages of liquid chromatography and mass spectrometry when used alone, and has greater advantages, and is widely used in various fields such as environment, food, and geological detection. The original LC-MS data is the basis for qualitative analysis of LC-MS, but it will contain interference from instrument noise, neutral particles, other compounds, etc. If the original LC-MS data is directly used for qualitative analysis of the mixture sample, the resulting Analysis results are unreliable. In addition, the complexity of LC-MS systems often makes it difficult for analysts to meet method detection limitations. Therefore, there is a need for an algorithm...

Claims


Application Information

Patent Timeline
Patent Type & Authority Patents(China)
IPC IPC(8): G01N30/86G01N30/72
CPCG01N30/8617G01N30/8631G01N30/72
Inventor 李文杰俞晓峰李锐韩双来杨继伟郭子杨
Owner HANGZHOU PUYU TECH DEV CO LTD
Why Eureka
Try Eureka