Image forming cytometer

a cytometer and image technology, applied in the field of image cytometry analysis, can solve the problems of difficult microscopy, poor contrast, and microscopy that requires specialised optical components, and achieves the effect of simple, effective and reliabl

Active Publication Date: 2019-10-29
CHEMOMETEC AS
View PDF43 Cites 0 Cited by
  • Summary
  • Abstract
  • Description
  • Claims
  • Application Information

AI Technical Summary

Benefits of technology

The present invention provides a simple, effective, and reliable method to capture images of biological particles with high contrast. This makes it suitable for identifying particles in Image Cytometry.

Problems solved by technology

Biological particles, such as mammalian cells, yeast and bacteria are relatively small, typically less than about 20 μm in diameter, which can make them difficult to view in microscopy unless some advanced techniques are applied.
When considering microscopy analysis of biological particles, such as biological cells both DF and BF microscopy methods render images of rather poor contrast.
Both methods have advantages as well as drawbacks when it comes to implementation for the identification of biological particles.
Phase contrast microscopy requires specialised optical components, while fluorescence microscopy is limited by selectivity defined by the fluorophore system used, which either must be present in the particles or bound to the particles.

Method used


Image

  • Image forming cytometer
  • Image forming cytometer
  • Image forming cytometer

Examples


example 1

Image Cytometer

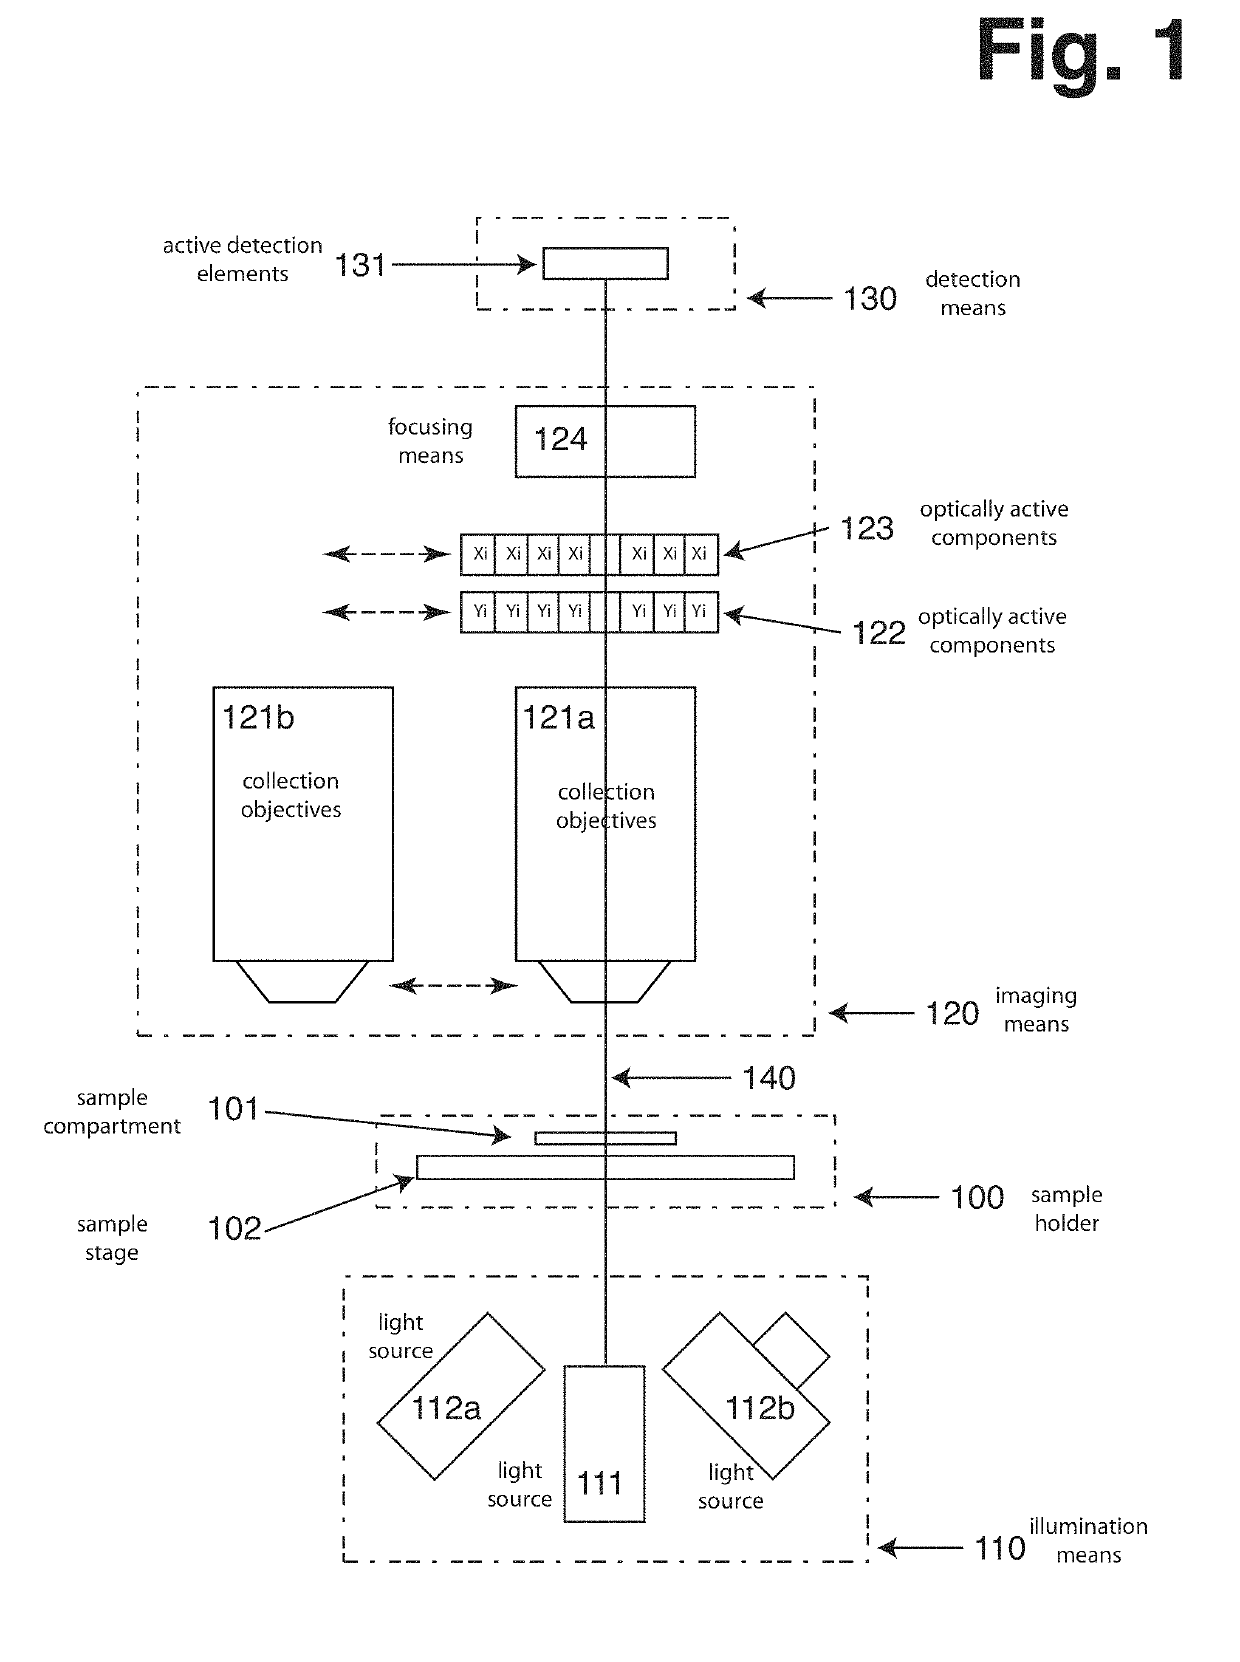
[0114]FIG. 1 illustrates possible configuration of an Image Cytometer including several preferred embodiments of the present invention. The illustration outlines 4 main groups of components, the sample holder (100), illumination means (110), imaging means (120) and detection means (130). Finally it illustrates the main optical axis of the Image Cytometer (140), along which majority of the optical components are arranged.

[0115]The sample holder can be moved along the optical axis relative to the imaging means, in order to assure that the sample is in focus alignment with the imaging means. The sample compartment (101) is placed on the sample stage (102) in the optical path. The sample compartment is typically attached to the sample stage but it can be released there from such that it can be removed from the Image Cytometer and replaced again through either manual or automated process. The sample stage can move in two directions perpendicular to the optical axis. This a...

example 2

Properties of Low Wavelength Microscopy

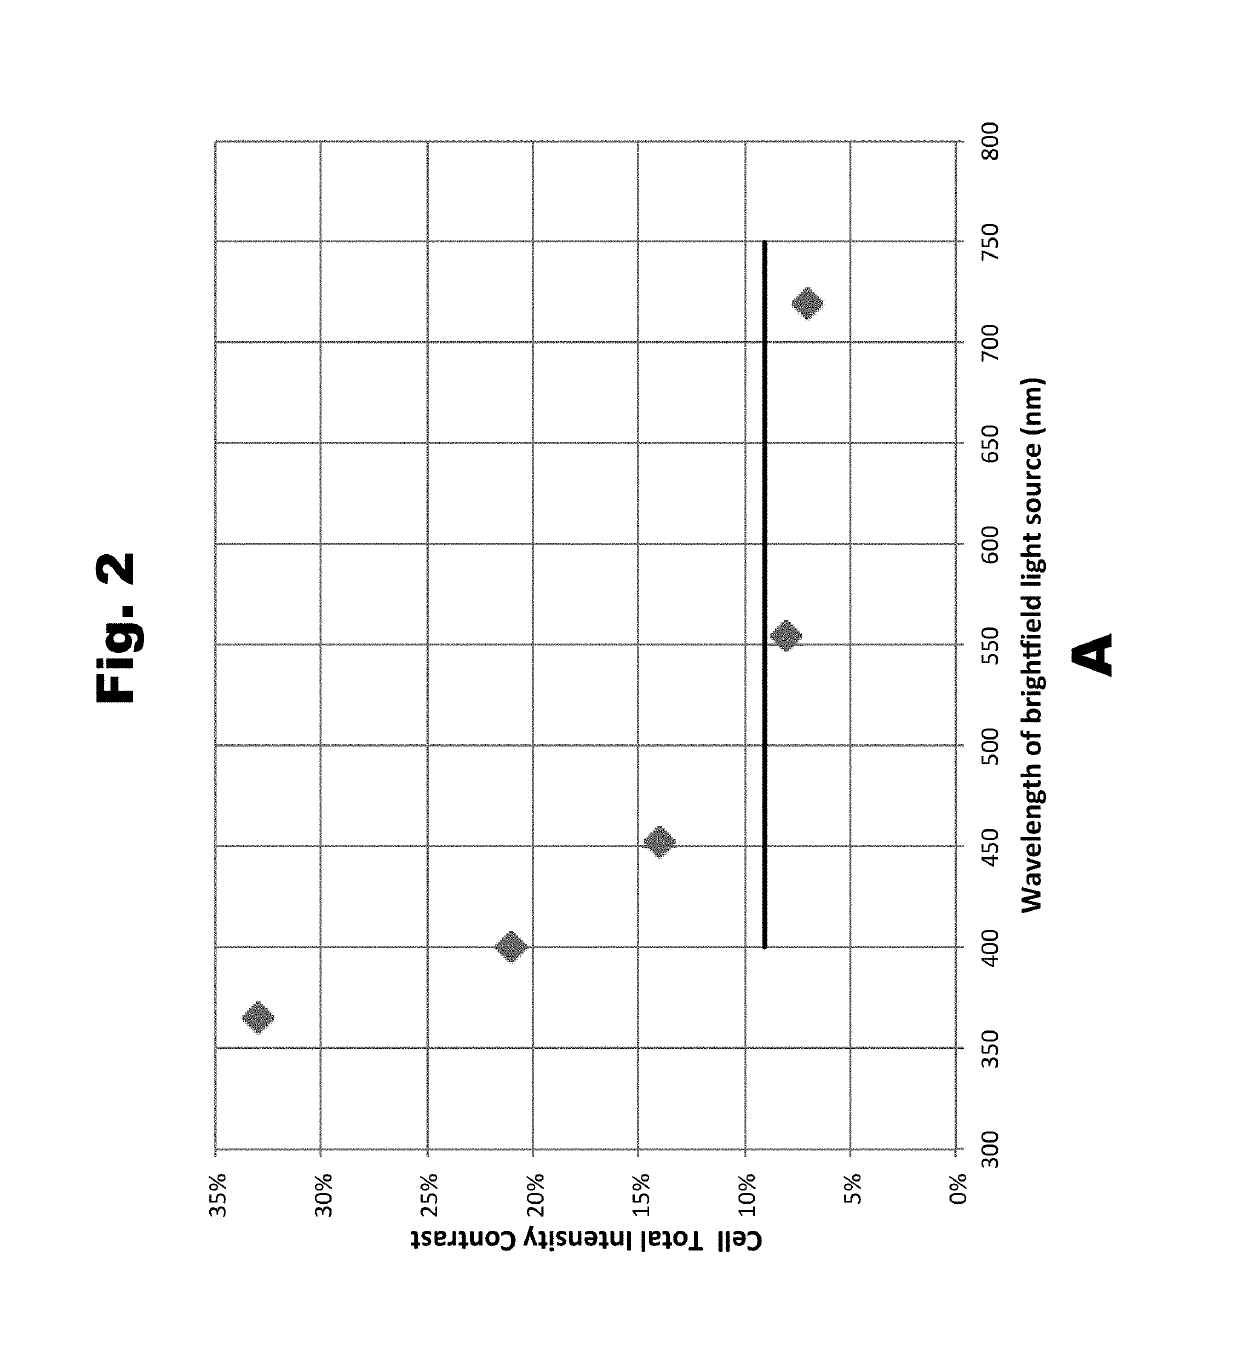
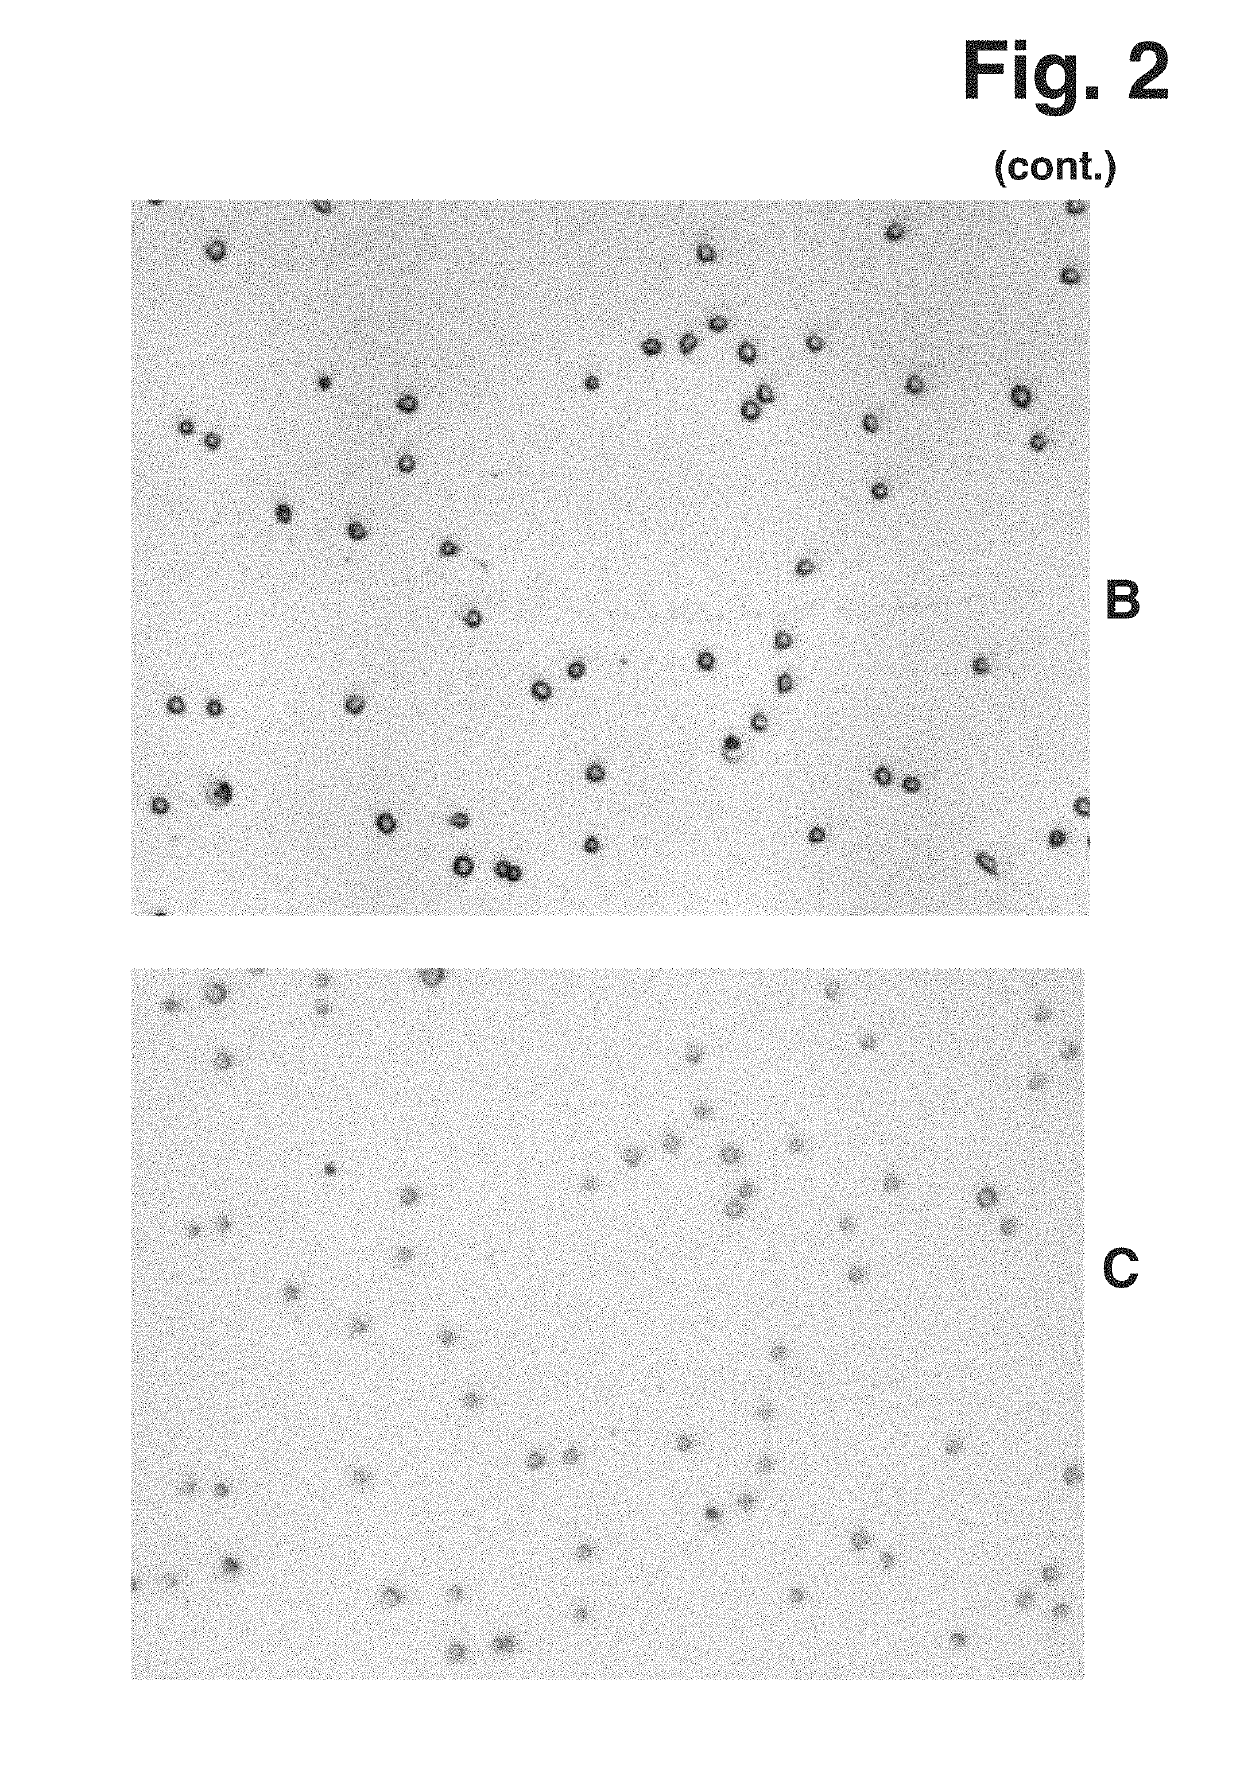
[0120]Contrast in Bright Field microscopy according to the present invention was investigated by measuring a sample of Jurkat cells (human leukemia cell line, subclone A3, ATCC CRL-2570). The measurements were performed using four light sources of different wavelength. Three of the light sources were single colour narrow-waveband Light Emitting Diodes (LEDs) and the fourth light source was a broad-waveband white LED. All light sources were in optical arrangement where emitted light was collimated when passing the sample.

[0121]The output from the narrow-waveband LEDs was used without modification but the output from the white LED was used with modification, as well as being modified using narrow-band filters. The wide-waveband light from the white LED represents typical conditions of visible microscopy. The principle wavelengths of the narrow-waveband light used in the measurement are listed in the following Table 2-1.

[0122]

TABLE 2-1List of Ligh...

example 3

Enhancement of Signal to Background

[0127]When performing fluorescence analysis of a biological sample it is important to manage excitation and emission light in order to obtain adequate contrast in the image. There are basically two approaches to improving contrast, firstly to use an excitation filter to reduce light of wavelength longer than what is used for the excitation of fluorescence and secondly to use an emission filter to reduce light of wavelength shorter than the fluorescent light from reaching the array of active detection elements.

[0128]In order to perform high-sensitivity fluorescence analysis, where signal contrast is an important aspect, it is necessary to consider all aspects of the optical system which affect the collected intensity information. This includes aspects such as excitation intensity, auto-fluorescence of any component of the system and attenuation of optical filters. In the task of improving contrast in collecting fluorescence spatial intensity informa...


PUM


Abstract

The present invention relates to methods and systems for image cytometry analysis, typically at low optical magnification, where analysis is based on detection of biological particles using UV bright field, dark field or one or more sources of excitation light. The system comprises illumination means (11, 112), a sample holder (100), a sample compartment (101), imaging means (120), collection means (121), light modulation means (122, 123), and detection means (130) with active detection elements (131).

Description

CROSS-REFERENCE TO RELATED APPLICATIONS[0001]This application is the U.S. national phase of foreign application Serial No. PCT / DK2014 / 050151, filed May 28, 2014, which claims priority to foreign application Serial No. PA 2013 70291, filed May 28, 2013, the contents of which are incorporated herein in their entirety.FIELD OF THE INVENTION[0002]The present invention relates to methods and systems for image cytometry analysis, typically at low optical magnification, where analysis is based on detection of biological particles.DESCRIPTION OF THE RELATED ART[0003]Microscopy has been used for the analysis of biological material for a long time. In order to see an object in a microscope it is necessary that the object displays optical properties that differs from the optical properties of the background and this difference is called contrast. Biological particles are typically largely made up of water, contained within the cell membrane, which makes them inherently similar to their surroun...

Claims


Application Information

Patent Timeline
Patent Type & Authority Patents(United States)
IPC IPC(8): G06K9/00G06T7/00G01N15/14G01N15/10G01N15/00
CPCG01N15/1434G06K9/00127G06T7/0012G01N2015/144G06T2207/10064G06T2207/30024G01N2015/0065G06T2207/10056G01N2015/1438G01N2015/1006G01N2015/1493G01N2015/1495G01N15/0227G01N15/1433G01N21/6428G01N2201/0612G06V20/69G01N15/01
Inventor GLENSBJERG, MARTINHOLM, JOHANKJAERULFF, SØRENRAVN HANSEN, FRANS EJNER
Owner CHEMOMETEC AS
Why Eureka
Try Eureka