Method for clustering signals in spectra

a signal clustering and spectra technology, applied in the field of spectra clustering signal clustering, can solve the problems of insufficient capture, inability to decide which signals to include in the signal cluster, and inability to be used in subsequent data analysis and model formation

Active Publication Date: 2005-09-22
BIO RAD LAB INC
View PDF8 Cites 12 Cited by
  • Summary
  • Abstract
  • Description
  • Claims
  • Application Information

AI Technical Summary

Benefits of technology

The present technology describes methods used during spectroscopy analysis to process spectral data obtained through different techniques such as Fourier transforms, frequency conversion, etc., which can be useful when analyzing complex samples containing many components at once. This allows us to determine how well these processes work over multiple hours without having to wait until all relevant parts have been done beforehand.

Problems solved by technology

The technical problem addressed in this patent is the need for a more accurate and reliable method for identifying markers for diagnostics and drug discovery processes. The current method of using a cluster window to capture all signals within a certain range of values may not be wide enough to capture all signals that should be in the same cluster, resulting in incorrect data analysis and model formation. There is also a problem of signals associated with different markers being erroneously included in the same cluster. The invention aims to address these issues and provide a more effective solution for identifying markers.

Method used


Image

  • Method for clustering signals in spectra
  • Method for clustering signals in spectra
  • Method for clustering signals in spectra

Examples


Embodiment Construction

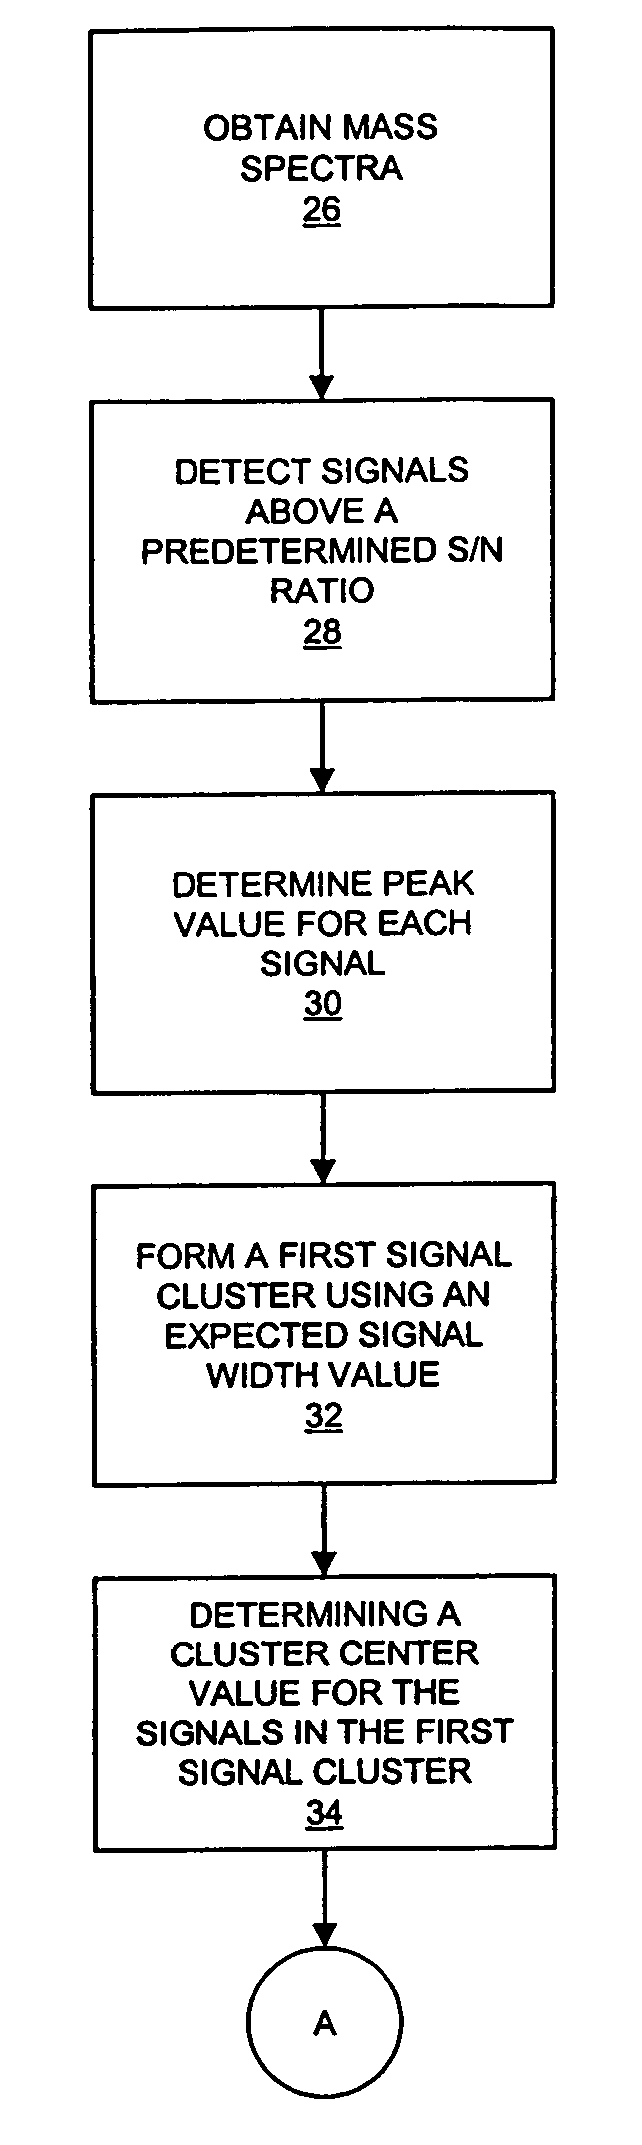
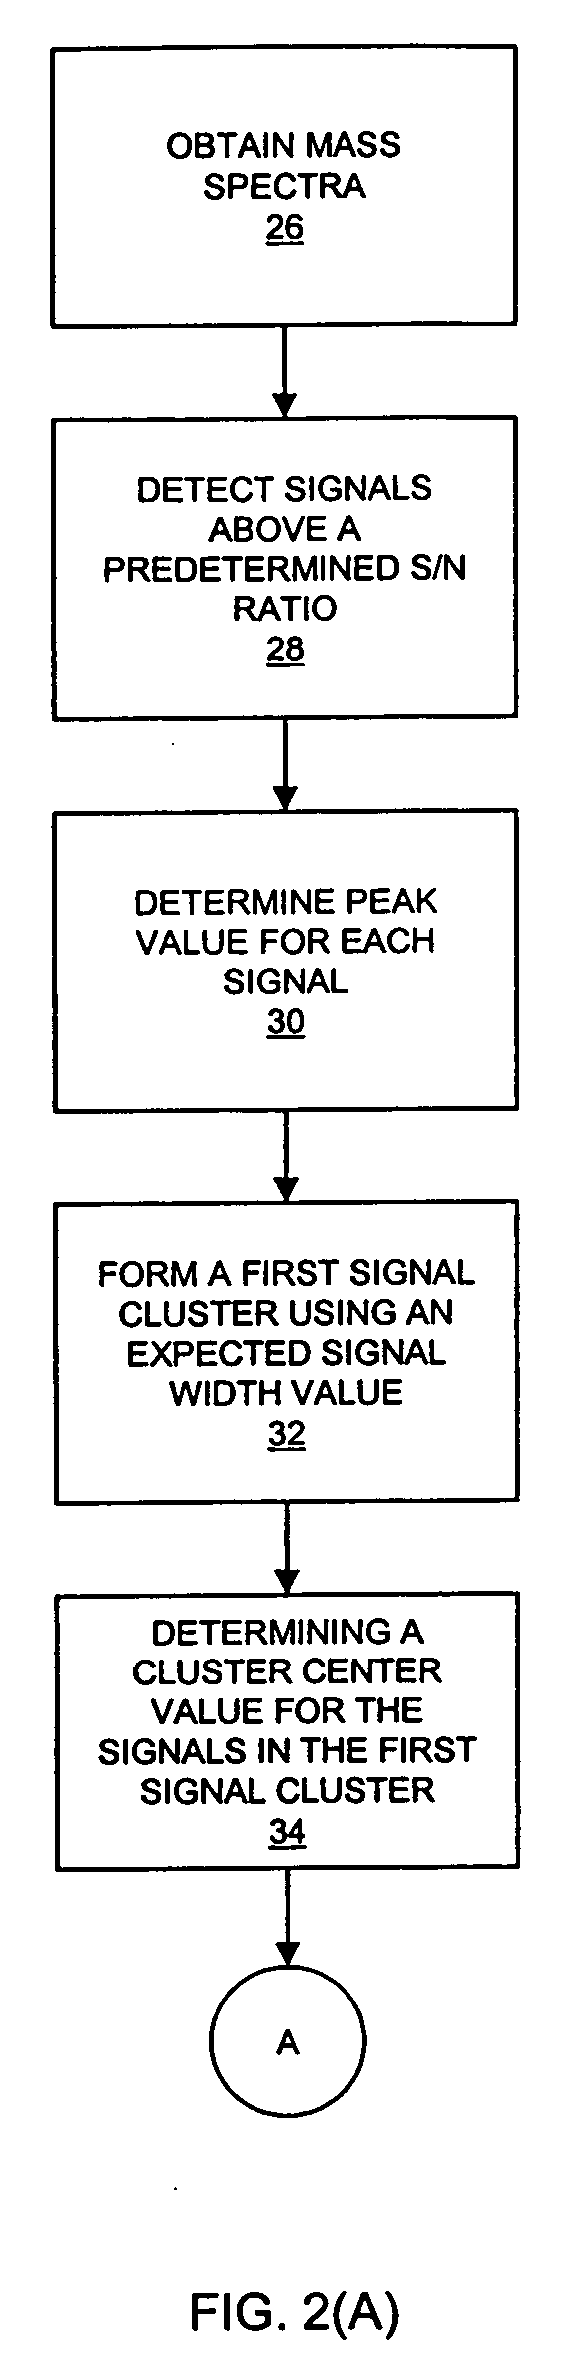
[0024] Some embodiments of the invention are directed to methods for processing spectra. The method comprises obtaining a plurality of spectra. Each spectrum in the plurality of spectra comprises a signal that is represented by signal strength as a function of time-of-flight, mass-to-charge ratio, or a value derived from time-of-flight or mass-to-charge ratio. An example of a “value derived from time-of-flight or mass-to-charge ratio” may be, for example, the mass of an ion.

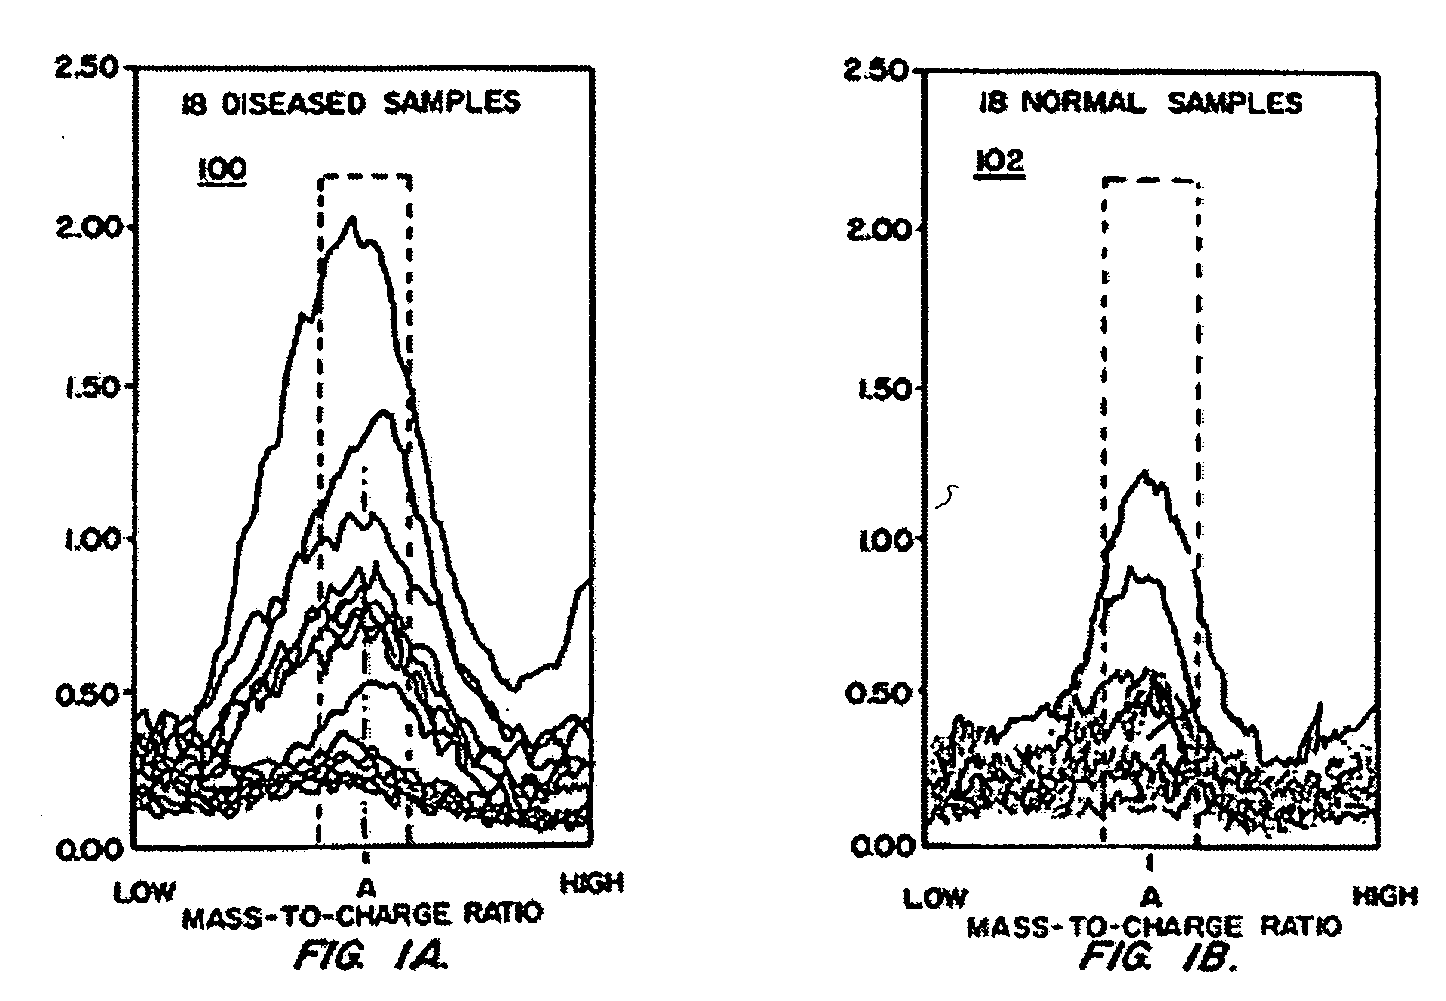
[0025] In one type of mass spectrum display format, the signals in the mass spectrum are generally in the form of “peaks”. After the spectra are obtained, one or more signal clusters are formed by selecting signals from the plurality of spectra with time-of-flights, mass-to-charge ratios, or values derived from time-of-flights or mass-to-charge ratios that are within the one or more corresponding cluster windows. The cluster windows are defined using expected signal width values. Expected signal width values are...


PUM


Abstract

Methods for processing spectra are disclosed. The method includes obtaining a plurality of spectra, each spectrum in the plurality of spectra comprising a signal including a signal strength as a function of time-of-flight, mass-to-charge ratio, or a value derived from time-of-flight or mass-to-charge ratio. Then, a signal cluster is formed by clustering signals from the plurality of spectra with time-of-flights, mass-to-charge ratios, or values derived from time-of-flights or mass-to-charge ratios that are within a window that is defined using an expected signal width value.

Description


Claims


Application Information

Patent Timeline
Owner BIO RAD LAB INC
Why Eureka
Try Eureka