

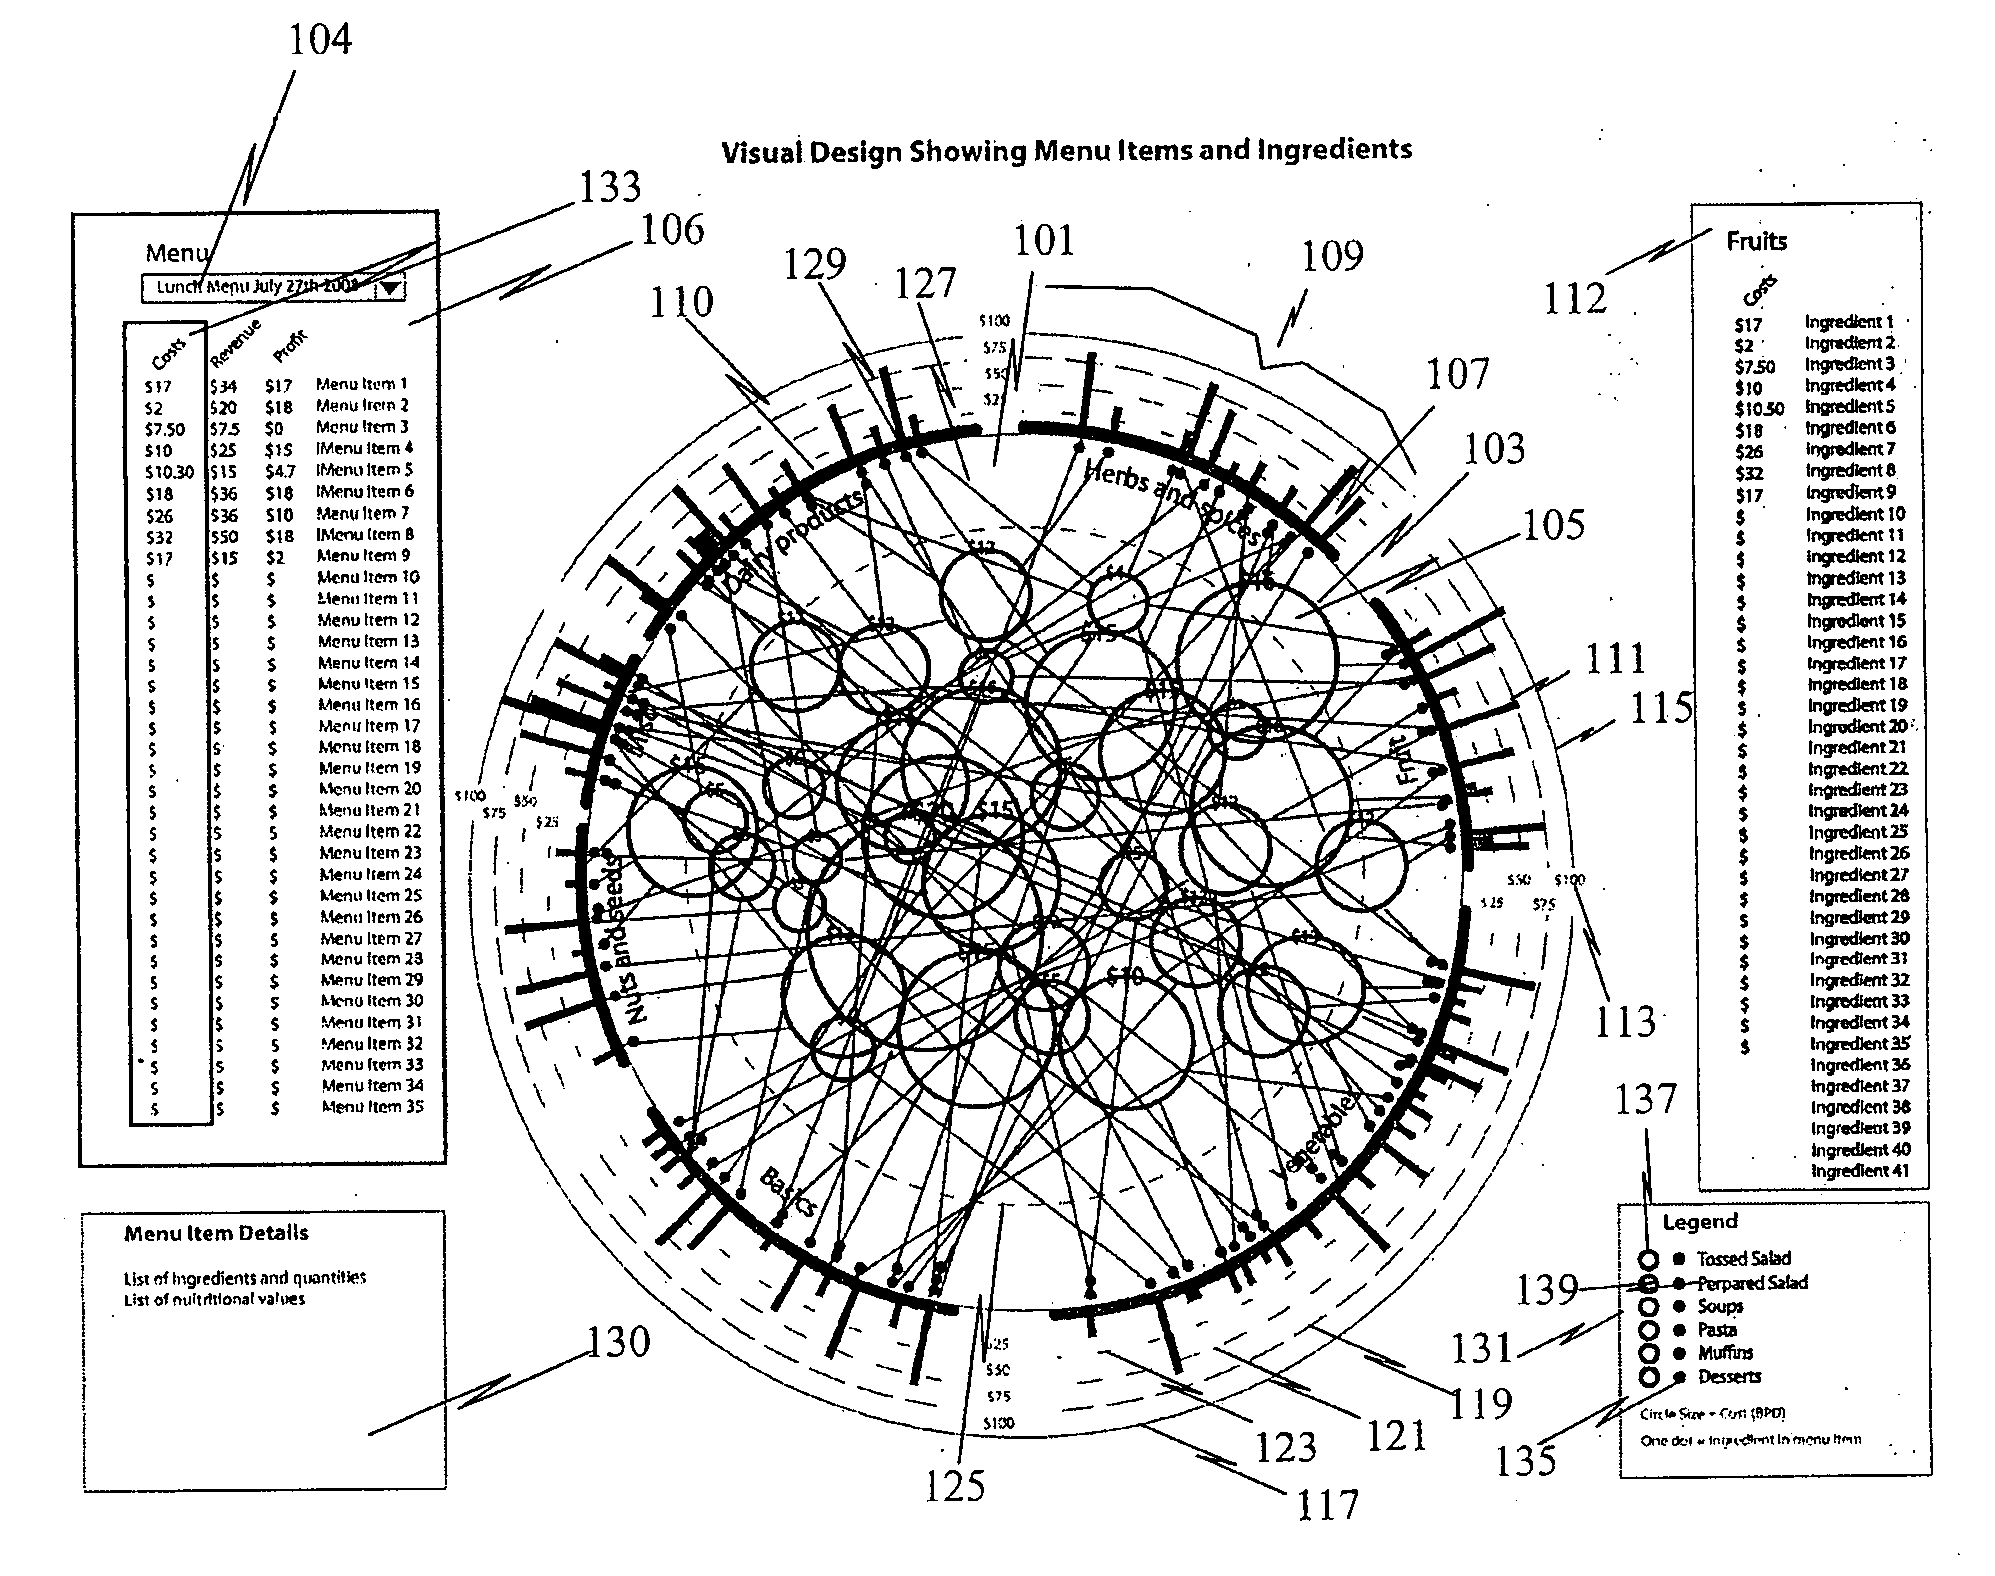
Component data visualization method
a data visualization and component technology, applied in image data processing, other databases retrieval, creation/generation of source code, etc., can solve the problems of less meaningful charts, complex visual representations created by data analysis, and well-established and often poorly implemented ways of representing data in traditional charts. , to achieve the effect of easy interpretation of information
- Summary
- Abstract
- Description
- Claims
- Application Information
AI Technical Summary
Benefits of technology
Problems solved by technology
Method used
Image

Examples
Embodiment Construction
[0024]The following described invention is suitable for use in conjunction with other methods, and the incorporation into one or more systems, described in an earlier filed US provisional patent application by the applicant. Namely, U.S. provisional patent application 61 / 074,347 filed on 20 Jun. 2008, and entitled METHODS, APPARATUS AND SYSTEMS FOR DATA VISUALISATION AND RELATED APPLICATIONS, which is hereby annexed as a reference.
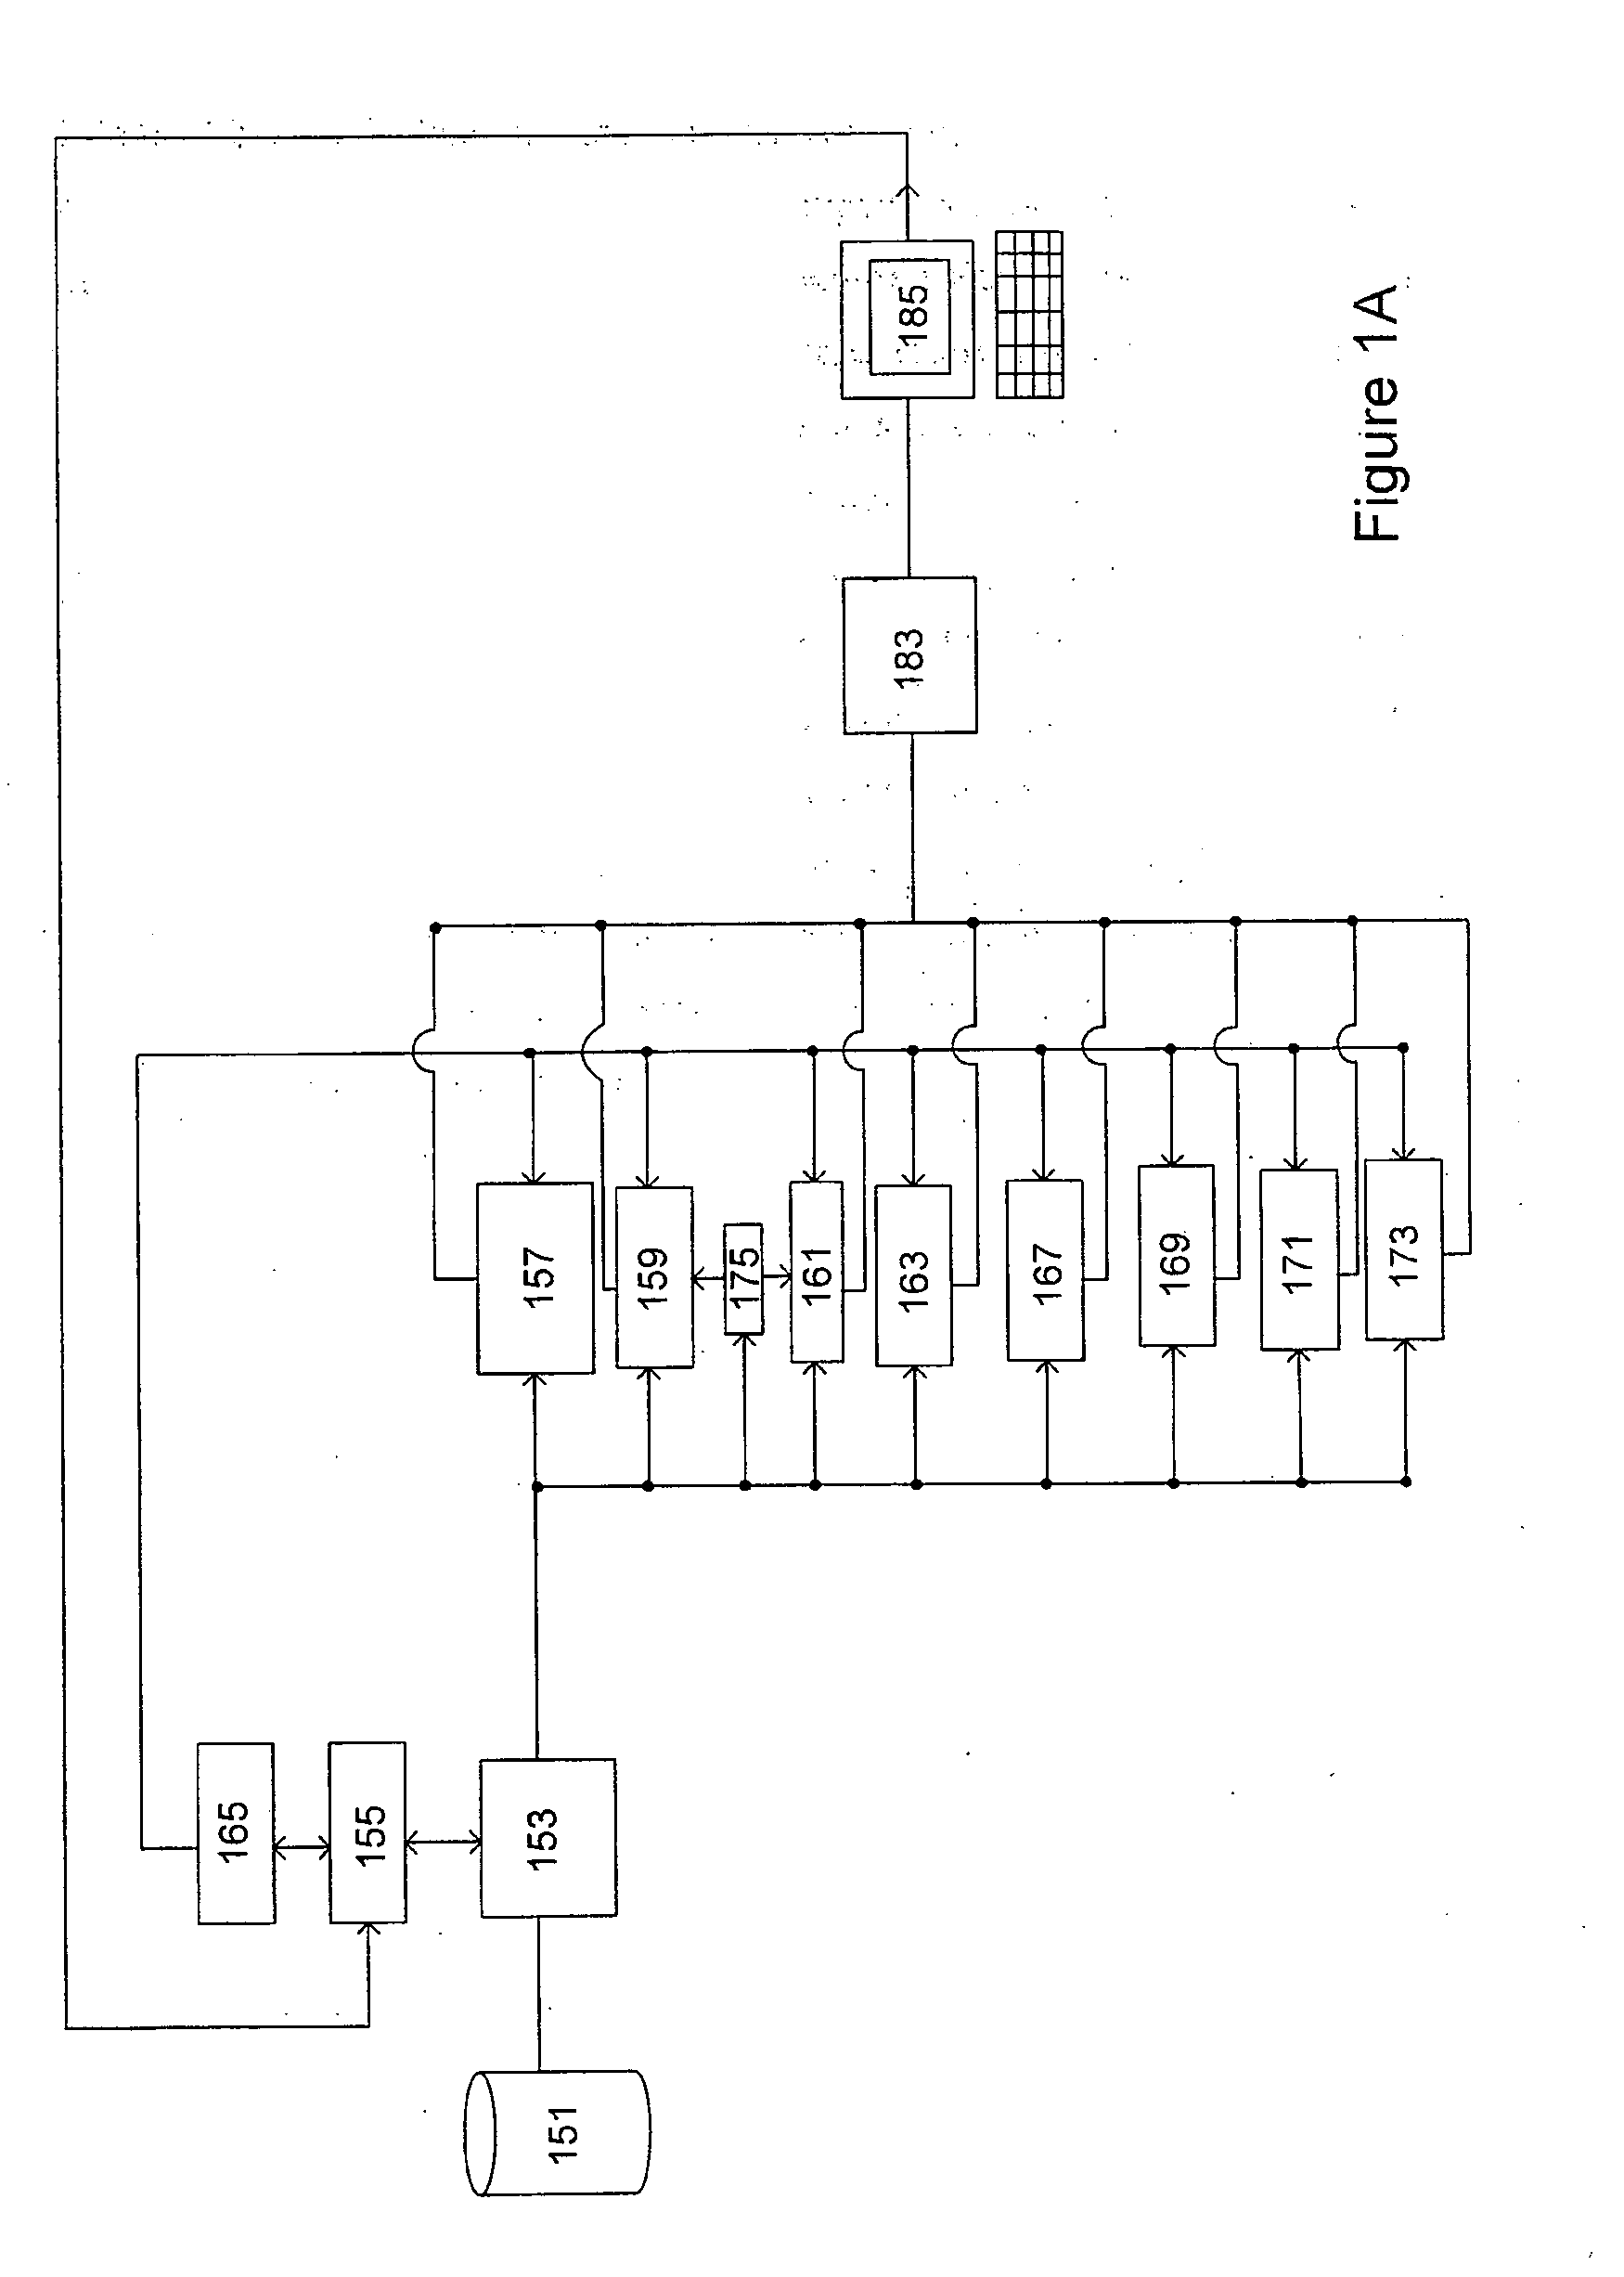
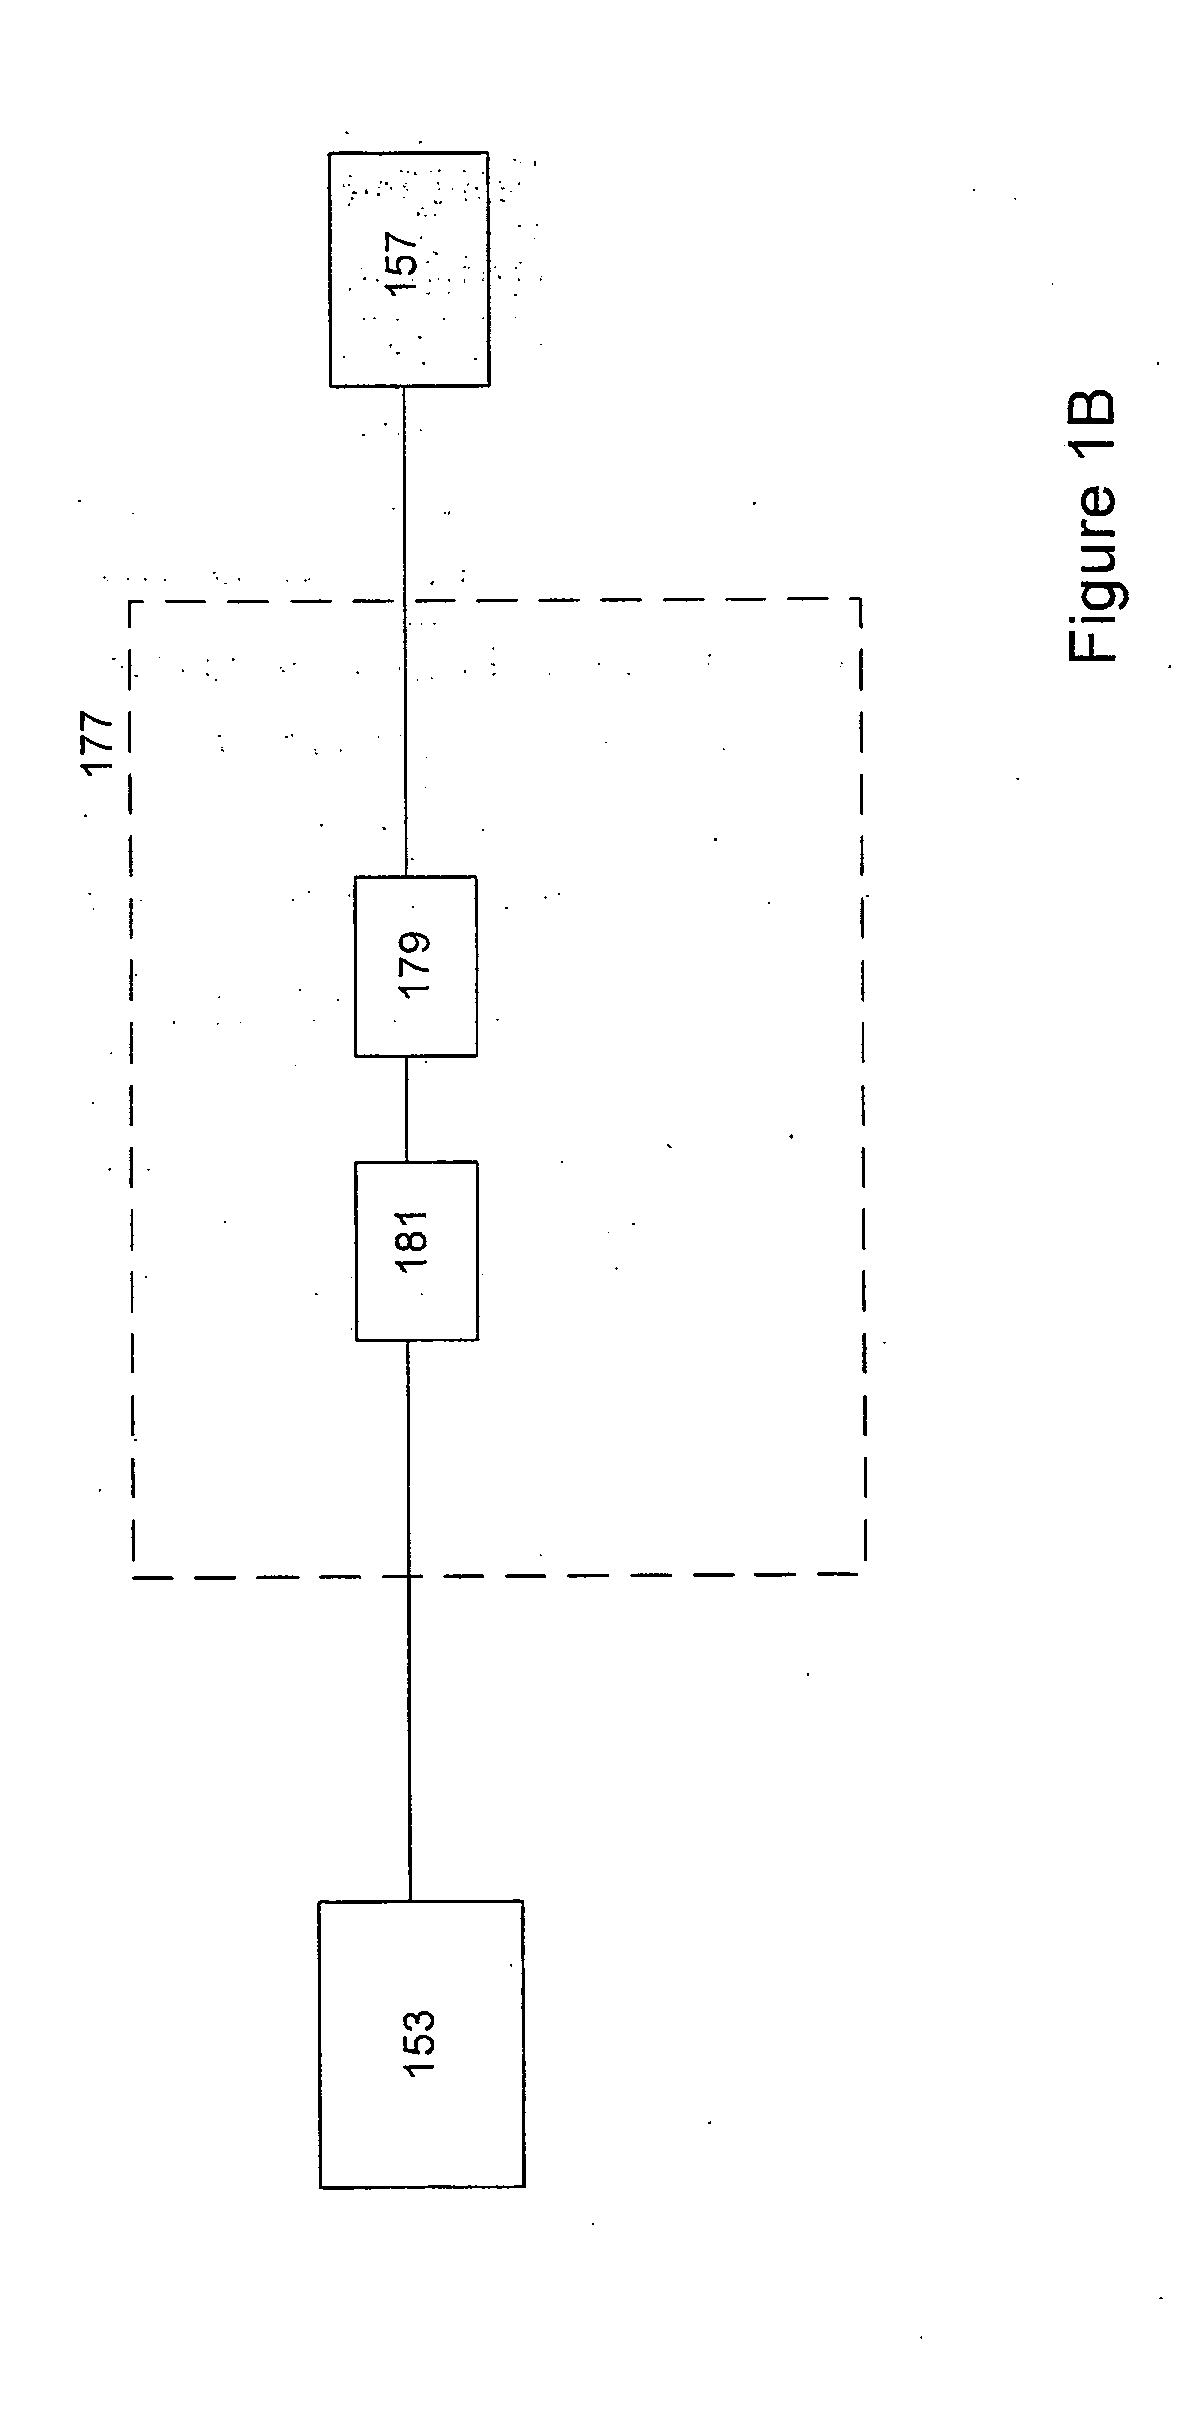
[0025]Embodiments of the present invention are described herein with reference to a system adapted or arranged to perform a method for representing metrics associated with a plurality of components.
[0026]In summary, the system includes at least a processor, one or more memory devices or an interface for connection to one or more memory devices, input and output interfaces for connection to external devices in order to enable the system to receive and operate upon instructions from one or more users or external systems, a data bus for internal and external ...
PUM
 Abstract
Description
Claims
Application Information