Membrane compositions for estimating soil microbial load
a membrane composition and soil technology, applied in the direction of microbiological testing/measurement, biochemistry apparatus and processes, etc., can solve the problems of low microbial load, low microbial biomass or other soil analytes, high cost, etc., and achieve easy, accurate and fast estimation of soil microbial load
- Summary
- Abstract
- Description
- Claims
- Application Information
AI Technical Summary
Benefits of technology
Problems solved by technology
Method used
Image
Examples
example 1
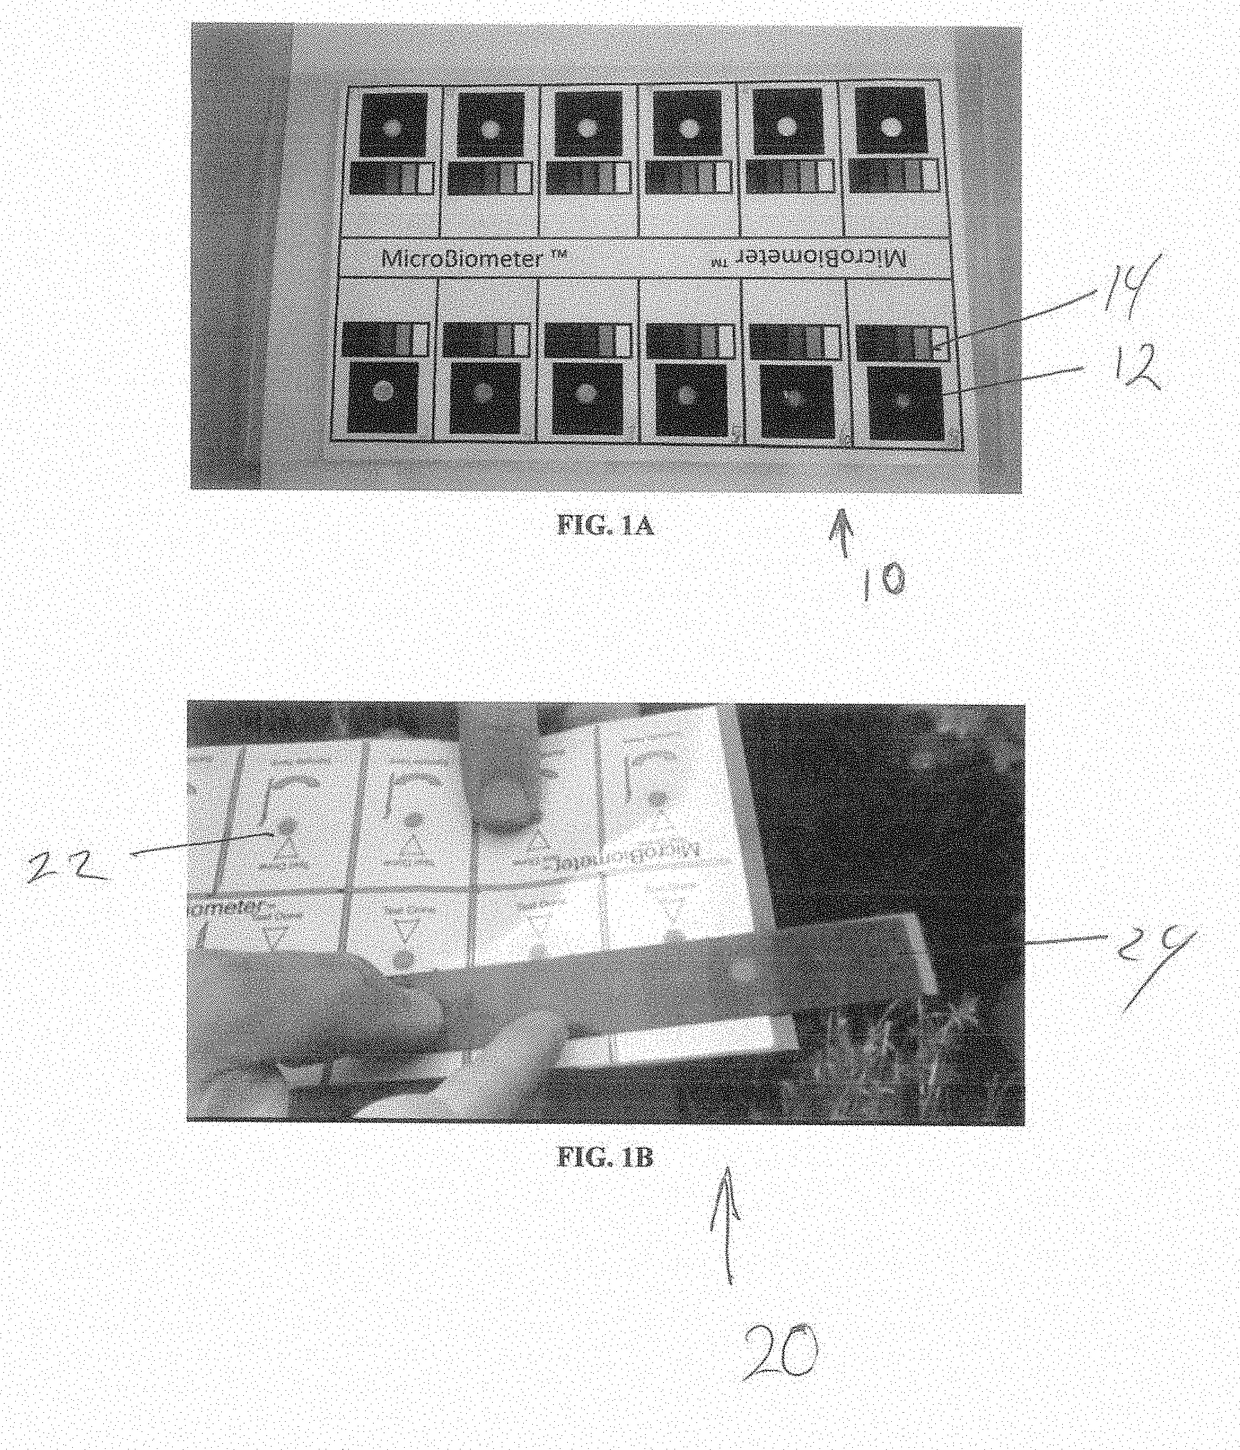
eter™ with Gray Scale
[0142]Materials and Methods
[0143]The methods of using the device, such as the MicroBiometer™ Strips, requires suspending a measured volume of soil or compost in extraction fluid, whisking at a controlled vigor and time to separate the microbes from the soil, allowing the soil particles to settle for a short time, for example, 10 minutes, and then quantitating the microbes suspended in the top 5 ml of solution by colorimetric instrument or via a strip assay.
[0144]An extraction sample requires filtration if it is to be read by absorbance. The sample usually does not require filtration before a strip assay. However, compost samples, because of debris, may require filtration, and can be read colorimetrically using grey scale on a membrane or spectrophotometrically.
[0145]The devices are shown in FIGS. 1A and 1B. A typical card contains 10 to 12 test windows 12, 22. The grey scale 14 is shown under the sample windows 12 in FIG. 1A. A red rectangle 24 is placed over th...
example 2
tion of Most Effective Extraction Fluid
[0146]Materials and Methods
[0147]Fresh soils were tested. ½ cc of soil was added to extraction fluid at 2% NaCl, 3.2% CaCl and 0.1% TWEEN® 20, or extraction fluid at 10% NaCl, 2.2% CaCl, 0.4% TWEEN®. All samples were whisked for 30 seconds using an adapted milk frother and then allowed to settle for 10 minutes before inserting serum separator as filter and reading A430 converting to mg / ug by curve.
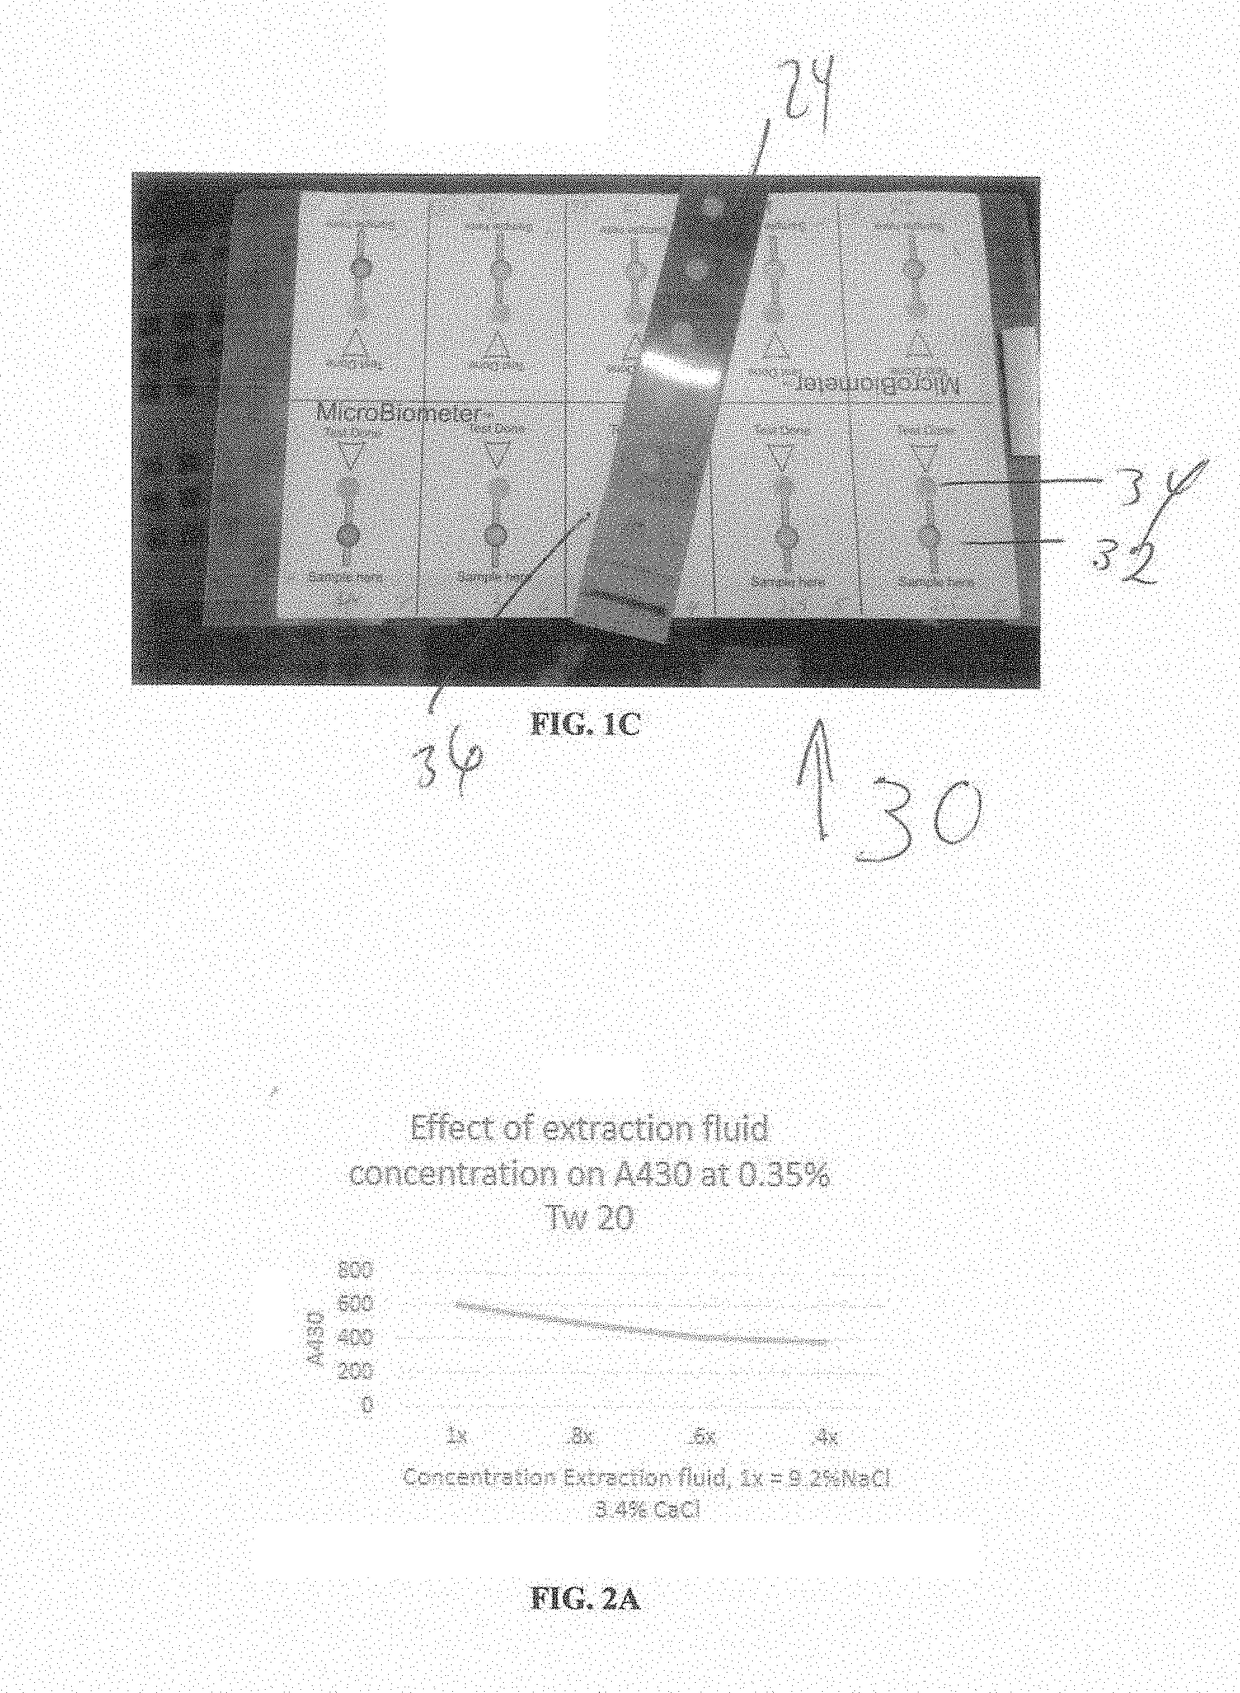
[0148]The effect of extraction fluid concentration: 1×, 0.8×, 0.6×, and 0.4×9.2% NaCl 3.4% CaCl with 0.35% Tween 200.35% Tween 20 on soil extraction efficiency was determined based on absorbance at 430 nm.
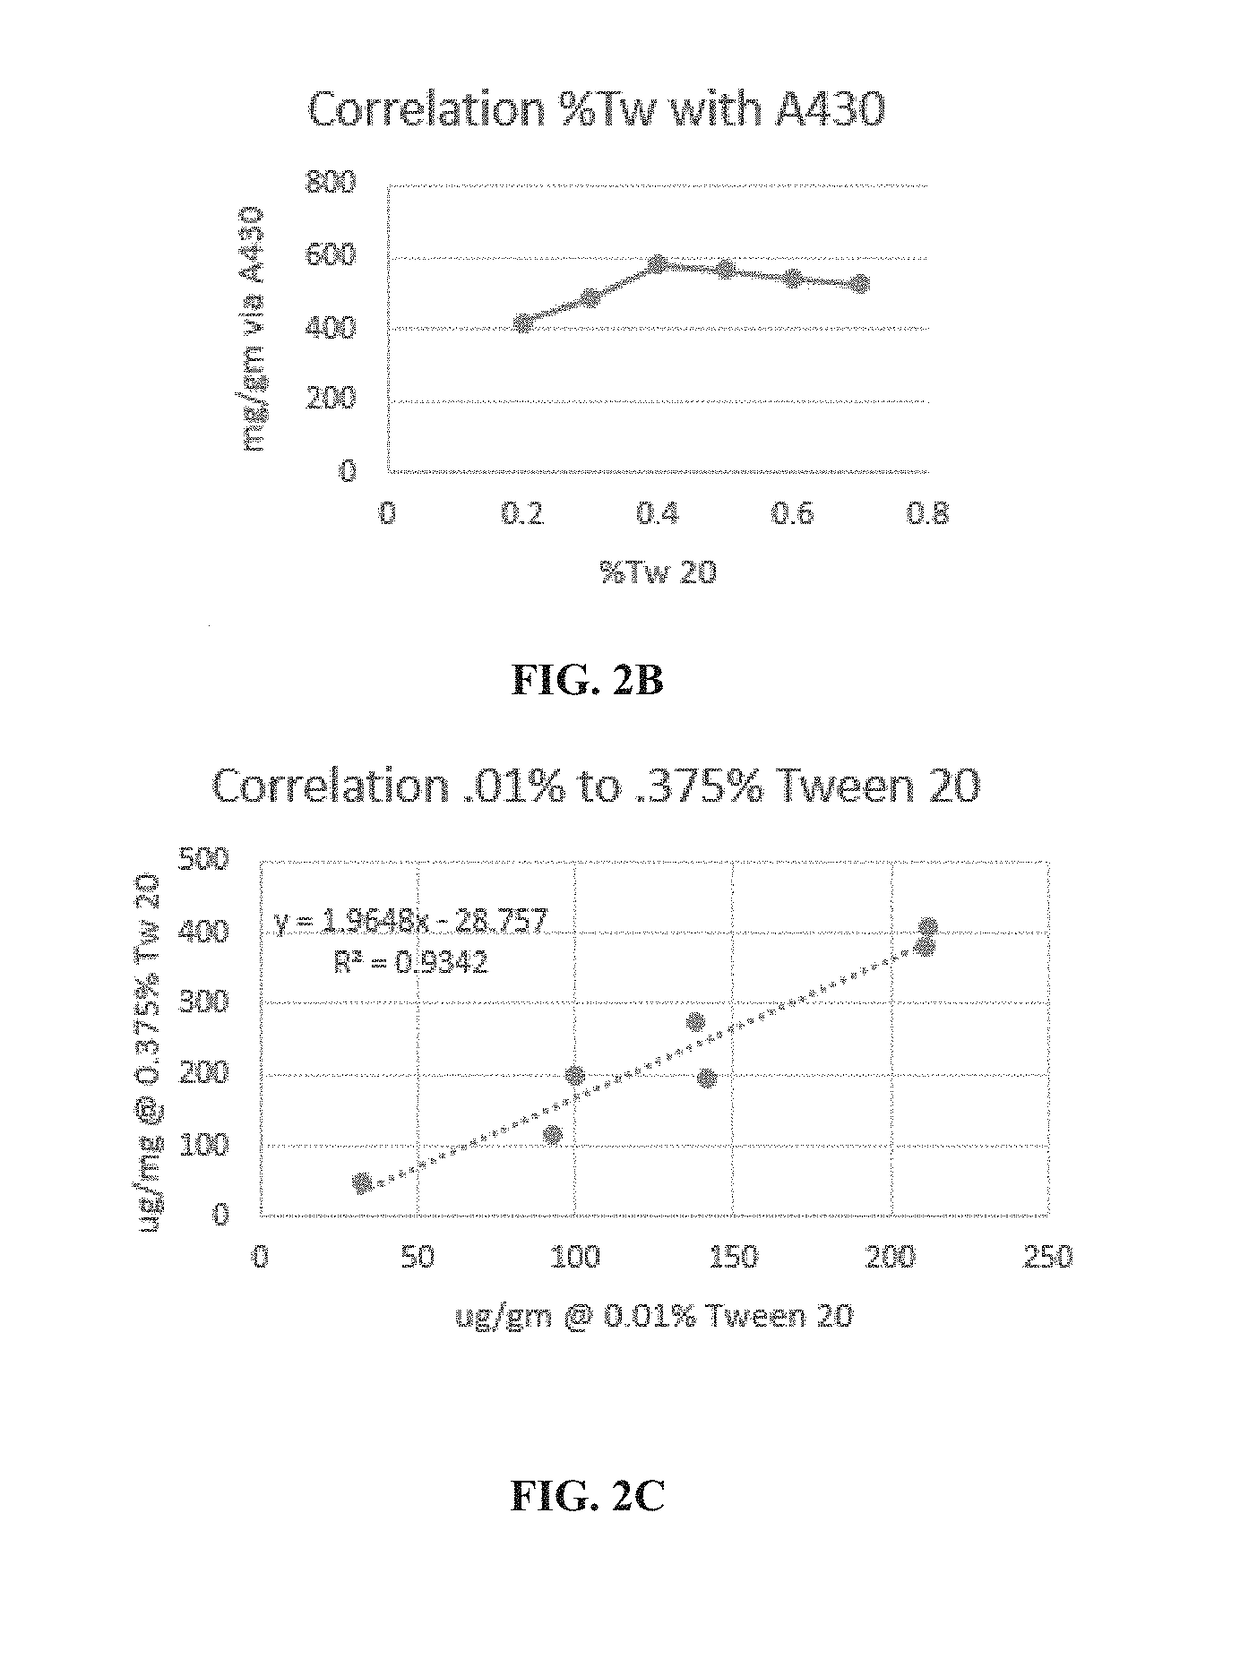
[0149]The effect on soil extraction as a function of % Tween 20 concentration: 0.2, 0.4, 0.6 and 0.8 on soil extraction efficiency was also assessed.
[0150]The correlation of soil extraction efficiency in the range of 0.01% to 0.375% Tween 20 was measured and calculated.
Results
[0151]FIG. 2A shows the correlation between extraction fluid concentration ...
example 3
on of Dose Response Curve
Methods and Materials
[0154]The same device and reagents were used as determined in Examples 1 and 2.
[0155]Soil sample extractions were tested by applying one drop to the first well, then 2, 3, 4, 5, 6, 8, 10, 12 and 16 drops.
[0156]A test sample was assayed on the membrane by applying 1 to 16 drops. The intensity was read on the grey scale as follows: samples that matched the level perfectly were rated a whole number. Samples whose intensity fell midway between 2 levels were assigned the number+0.5. Samples that were slightly darker or lighter than the grey scale they most matched were assigned +0.02 or −0.2.
Results
[0157]FIG. 3 is a graph illustrating the dose response seen when a sample is read on the grey scale.
PUM
 Abstract
Description
Claims
Application Information
 - R&D
- Intellectual Property
- Life Sciences
- Materials
- Tech Scout
- Unparalleled Data Quality
- Higher Quality Content
- 60% Fewer Hallucinations
Browse by: Latest US Patents, China's latest patents, Technical Efficacy Thesaurus, Application Domain, Technology Topic, Popular Technical Reports.
© 2025 PatSnap. All rights reserved.Legal|Privacy policy|Modern Slavery Act Transparency Statement|Sitemap|About US| Contact US: help@patsnap.com


