
Membrane compositions for estimating soil microbial load

a membrane composition and soil technology, applied in the direction of microbiological testing/measurement, biochemistry apparatus and processes, etc., can solve the problems of low microbial load, low microbial biomass or other soil analytes, high cost, etc., and achieve easy, accurate and fast estimation of soil microbial load

Active Publication Date: 2019-01-15
PROLIFIC EARTH SCI
View PDF2 Cites 2 Cited by
  • Summary
  • Abstract
  • Description
  • Claims
  • Application Information

AI Technical Summary

Benefits of technology

This approach allows for rapid, on-site measurement of soil microbial load, reducing costs and time, while minimizing laboratory variability and interference from soil particles, providing consistent results and enabling timely decision-making in agricultural practices.

Problems solved by technology

Measurement of microbial biomass or other soil analytes is difficult because of the large amount of particulate matter that is irrelevant to the measurement of these analytes and because the color of an extract may preclude assaying for analytes by methods such as spectrophotometery, turbidity, nephalometry and visual comparison.
However, tests and test standardization to establish the microbial content of soils are not extensively utilized in large part due to the fact that existing methods are laboratory tests and carry a high cost or have poor performance.
These estimates are based upon laboratory tests that are costly, labor intensive and results are not available for 7-21 days.
Because less than 10% of soil microbes can be cultured and then only with great difficulty and time, analyses may be performed by direct counting using a microscope and a diluted sample on a slide.
The slide can be difficult to read because microbes are attached to the soil particles, and expertise is required to distinguish between bacteria, fungi and protozoa, rendering these tests prohibitively expensive for use as routine quality control.
In addition, soil samples must be transported to the laboratory for analysis during which time it has been shown that microbial biomass can rapidly decline, and it can take days or weeks for the results to be reported.
These methods are not practical for estimation of the microbial content of composts and compost extracts, which must be used within one or two days of formulation.
Further, the results are not consistent from lab to lab, due to the subjective nature of visual counts.
Both of these methods do not measure biomass but infer it from microbial parameters, thus there is not excellent correlation from method to method.
The lab to lab variability of these methods is due to the fact that they are complex procedures performed slightly differently from lab to lab, they are technique dependent and the microbial biomass measured is undoubted heavily influenced by the various preparation procedures that are used.
However, this method is problematic for measurement of the bacterial content of soil samples because the particles and pigments in soil also contribute to turbidity, reflectance and / or transmittance measurements.
In addition, many microbes in soil are firmly attached to the soil particles and do not readily go into solution.
Further, it is not practical to apply these methods to a field test to assess microbial biomass in soil because of the need for a turbidometer or spectrophotometer, which precludes efficient use in the field.

Method used


Image

  • Membrane compositions for estimating soil microbial load
  • Membrane compositions for estimating soil microbial load
  • Membrane compositions for estimating soil microbial load

Examples


example 1

eter™ with Gray Scale

[0143]Materials and Methods

[0144]The methods of using the device, such as the MicroBiometer™ Strips, requires suspending a measured volume of soil or compost in extraction fluid, whisking at a controlled vigor and time to separate the microbes from the soil, allowing the soil particles to settle for a short time, for example, 10 minutes, and then quantitating the microbes suspended in the top 5 ml of solution by colorimetric instrument or via a strip assay.

[0145]An extraction sample requires filtration if it is to be read by absorbance. The sample usually does not require filtration before a strip assay. However, compost samples, because of debris, may require filtration, and can be read colorimetrically using grey scale on a membrane or spectrophotometrically.

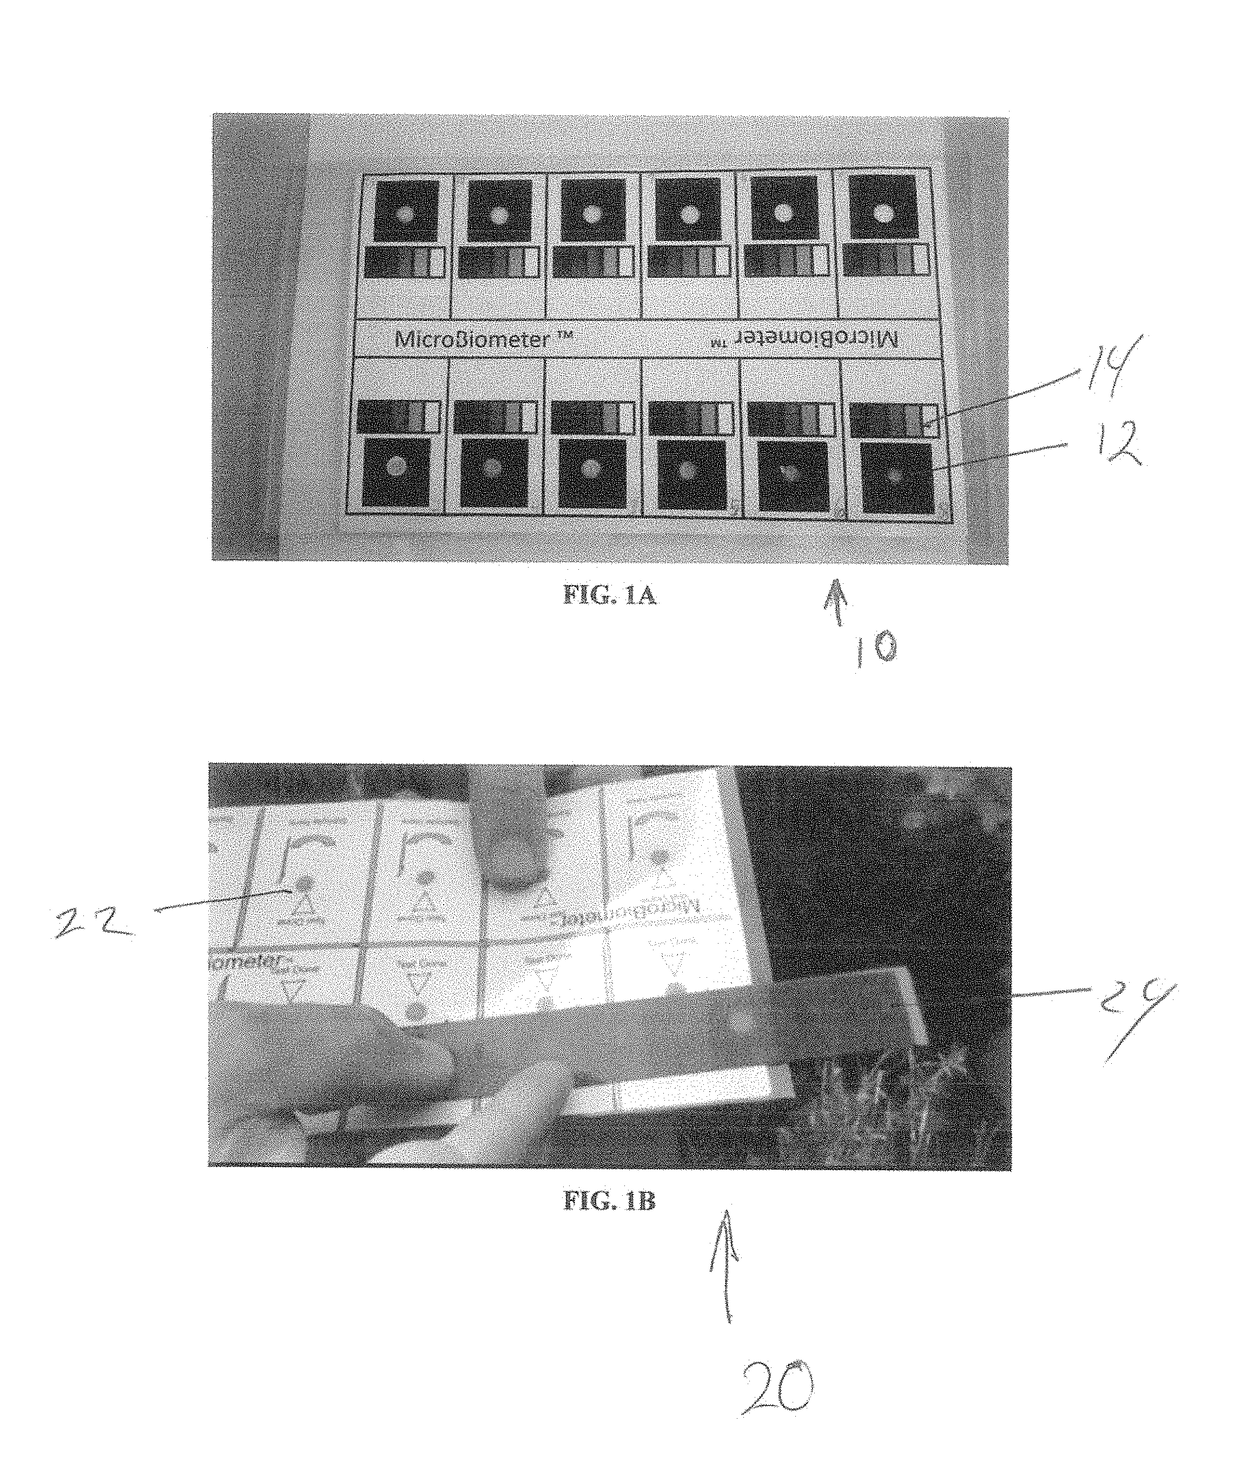
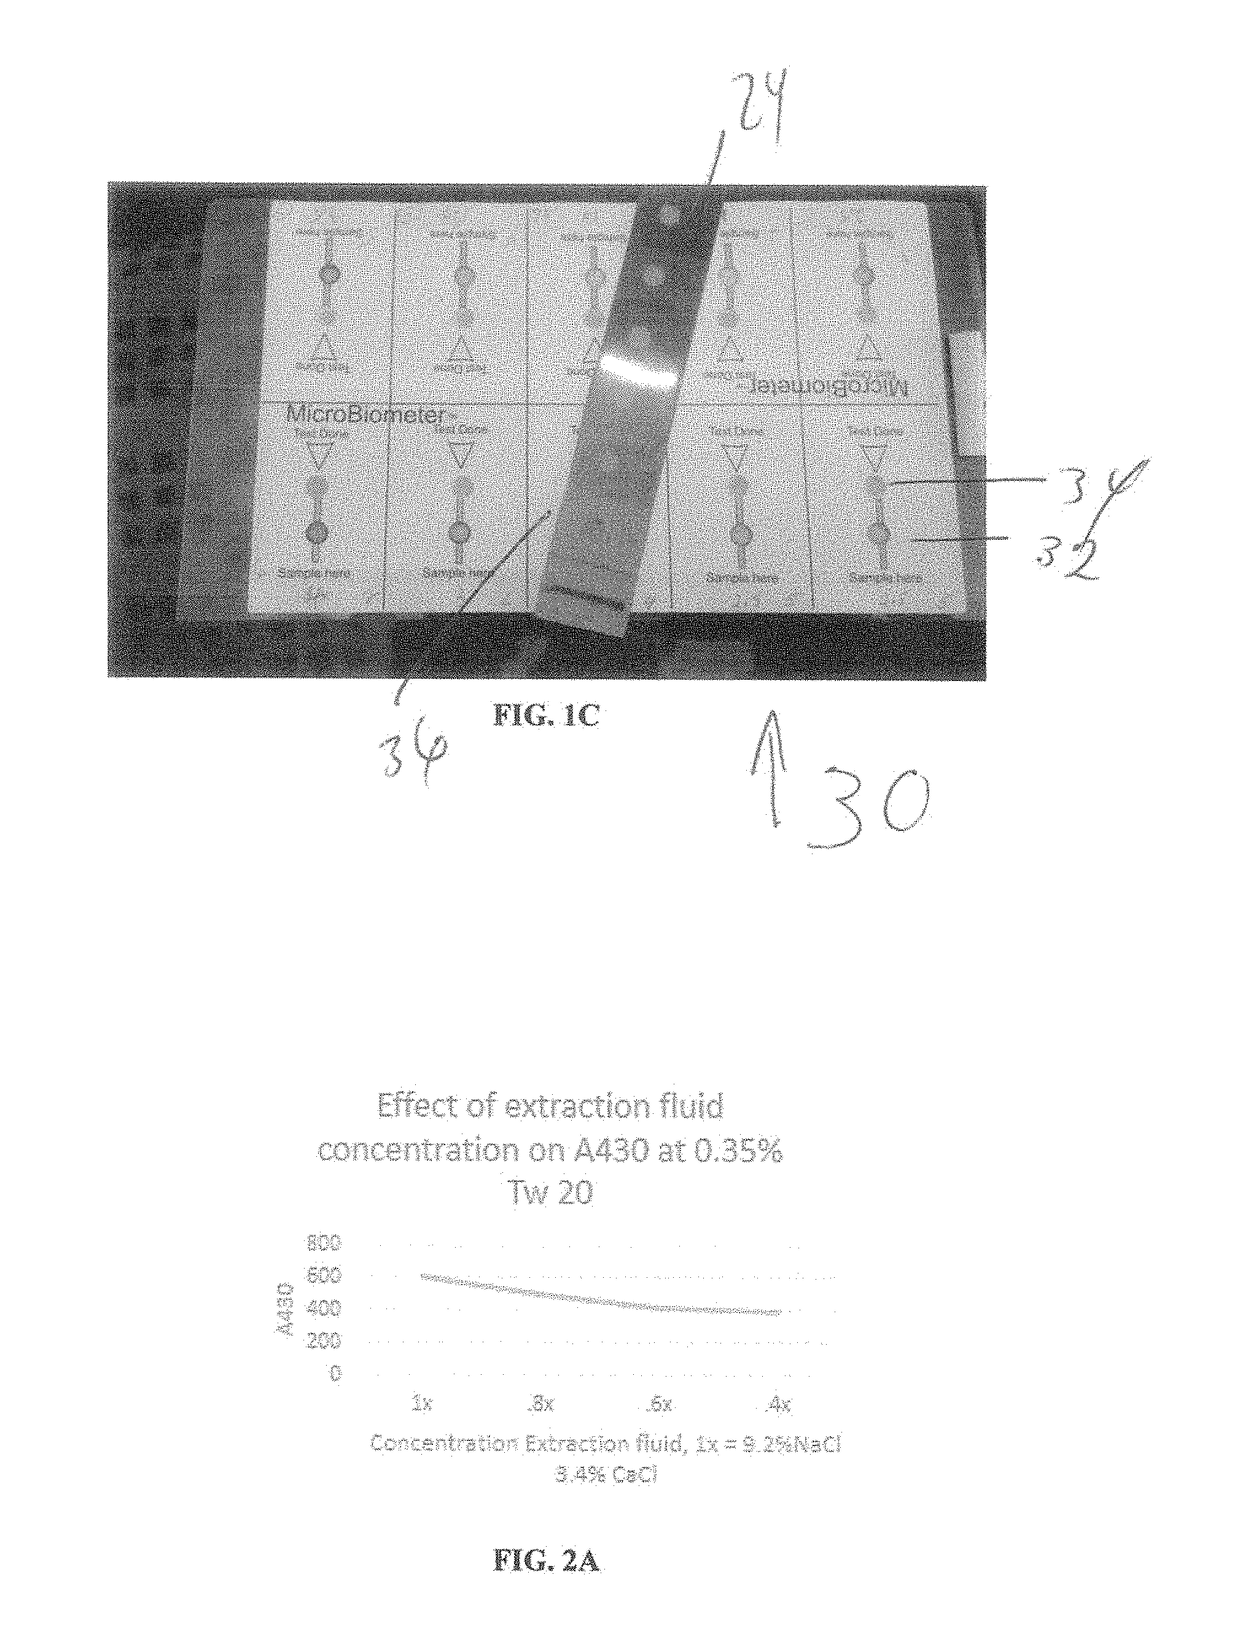
[0146]The devices are shown in FIGS. 1A and 1B. A typical card contains 10 to 12 test windows 12, 22. The grey scale 14 is shown under the sample windows 12 in FIG. 1A. A red rectangle 24 is placed over th...

example 2

tion of Most Effective Extraction Fluid

Materials and Methods

[0147]Fresh soils were tested. ½ cc of soil was added to extraction fluid at 2% NaCl, 3.2% CaCl and 0.1% TWEEN® 20, or extraction fluid at 10% NaCl, 2.2% CaCl, 0.4% TWEEN®. All samples were whisked for 30 seconds using an adapted milk frother and then allowed to settle for 10 minutes before inserting serum separator as filter and reading A430 converting to mg / ug by curve.

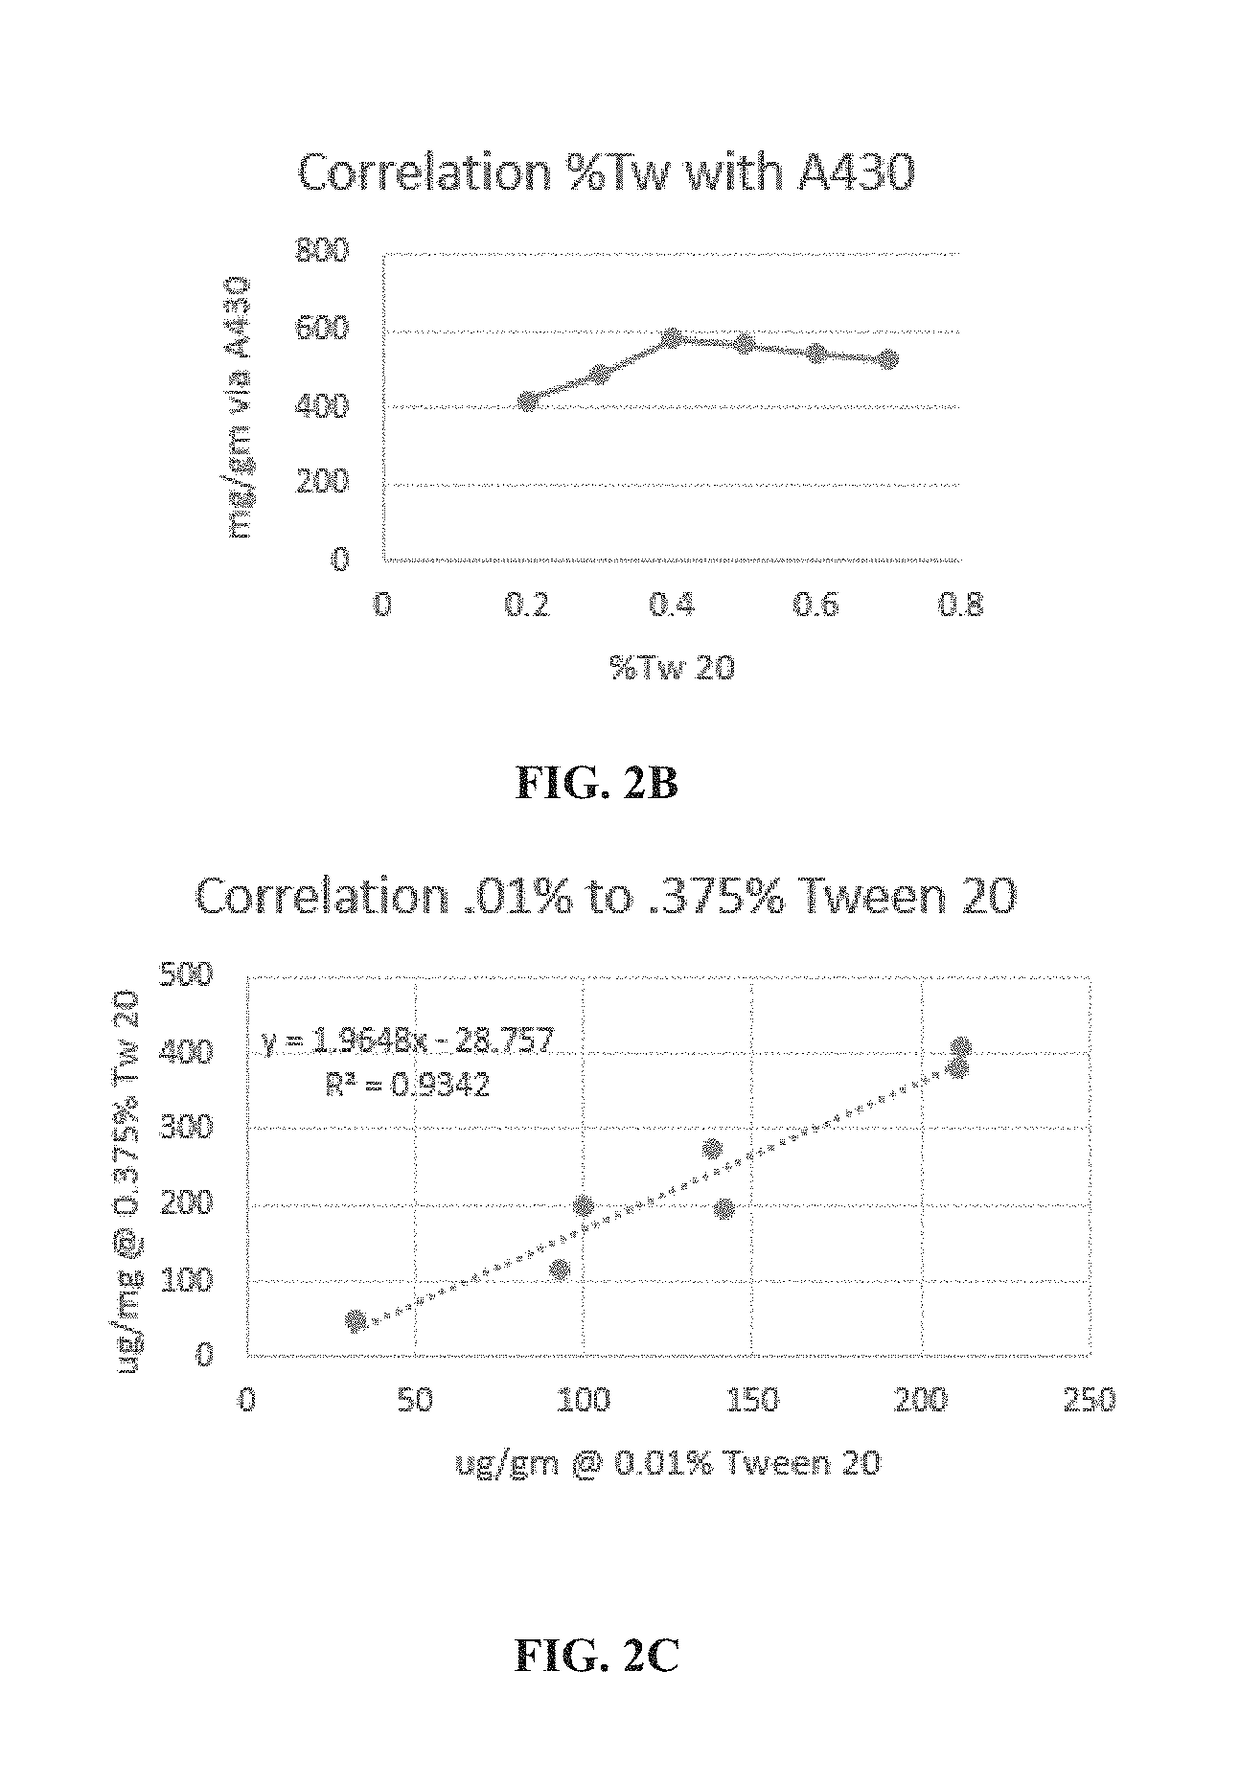
[0148]The effect of extraction fluid concentration: 1×, 0.8×, 0.6×, and 0.4×9.2% NaCl 3.4% CaCl with 0.35% Tween 200.35% Tween 20 on soil extraction efficiency was determined based on absorbance at 430 nm.

[0149]The effect on soil extraction as a function of % Tween 20 concentration: 0.2, 0.4, 0.6 and 0.8 on soil extraction efficiency was also assessed.

[0150]The correlation of soil extraction efficiency in the range of 0.01% to 0.375% Tween 20 was measured and calculated.

Results

[0151]FIG. 2A shows the correlation between extraction fluid concentration (1×, 0...

example 3

on of Dose Response Curve

Methods and Materials

[0154]The same device and reagents were used as determined in Examples 1 and 2.

[0155]Soil sample extractions were tested by applying one drop to the first well, then 2, 3, 4, 5, 6, 8, 10, 12 and 16 drops.

[0156]A test sample was assayed on the membrane by applying 1 to 16 drops. The intensity was read on the grey scale as follows: samples that matched the level perfectly were rated a whole number. Samples whose intensity fell midway between 2 levels were assigned the number+0.5. Samples that were slightly darker or lighter than the grey scale they most matched were assigned +0.02 or −0.2.

Results

[0157]FIG. 3 is a graph illustrating the dose response seen when a sample is read on the grey scale.


PUM

PropertyMeasurementUnit
sizeaaaaaaaaaa
sizeaaaaaaaaaa
depthaaaaaaaaaa

Abstract

Devices, methods, and kits for easy, accurate, and fast estimation of soil microbial load are provided. The devices include membranes that are rapidly wettable with aqueous fluids and retain soil microorganisms of up to 200 micrometers in size, without retaining soil pigments. The method requires reconstituting a soil sample in an extraction fluid so that the microorganisms in the soil sample are released from particles of the soil sample and into the extraction fluid. The method does not require a filtration step. The extraction fluid containing the microorganisms suspended therein is then pipetted onto the membrane device, or the membrane is dipped into the extraction fluid. The color appearing on the membrane is then compared to color intensity gray scale strips to determine the soil microbial load.

Description

STATEMENT OF FEDERALLY SPONSORED RESEARCH[0001]None.FIELD OF THE INVENTION[0002]The invention is generally directed to methods and devices for easy and fast colorimetric estimation of a soil microbial load. without the requirement for spectrophotometers, turbidity detectors, or sample filtration.BACKGROUND OF THE INVENTION[0003]Measurement of microbial biomass or other soil analytes is difficult because of the large amount of particulate matter that is irrelevant to the measurement of these analytes and because the color of an extract may preclude assaying for analytes by methods such as spectrophotometery, turbidity, nephalometry and visual comparison. One of the most difficult parameters to measure is Microbial Biomass which is an excellent indicator of soil and compost quality and is a predictor of soil fertility. Soil microbes recycle the organic matter in soil and convert it into forms that can be utilized by plants. Bacteria represent the most numerous of the microbial life in...

Claims


Application Information

Patent Timeline
Patent Type & Authority Patents(United States)
IPC IPC(8): C12Q1/06C12Q1/24C12Q1/04
CPCC12Q1/06C12Q1/24C12Q1/04
Inventor FITZPATRICK, JUDITH
Owner PROLIFIC EARTH SCI
Learn More