System and method of chart data layout

a chart data and data layout technology, applied in the field of report layouts, can solve the problems of time-consuming and error-prone process of understanding data, traditional charts are limited in space, and business users need to consume a large amount of information quickly

Inactive Publication Date: 2014-02-18
INT BUSINESS MASCH CORP
View PDF12 Cites 21 Cited by
  • Summary
  • Abstract
  • Description
  • Claims
  • Application Information

AI Technical Summary

Problems solved by technology

Business users need to consume a large amount of information quickly.
This made the process of understanding the data both time consuming and error prone.
Traditional charts are limited in space.
To provide all the information required in traditional charting methods can produce complex or long reports.
It can also be difficult for a reader of the report to understand the relationships between disjoint data.

Method used


Image

  • System and method of chart data layout
  • System and method of chart data layout
  • System and method of chart data layout

Examples


Embodiment Construction

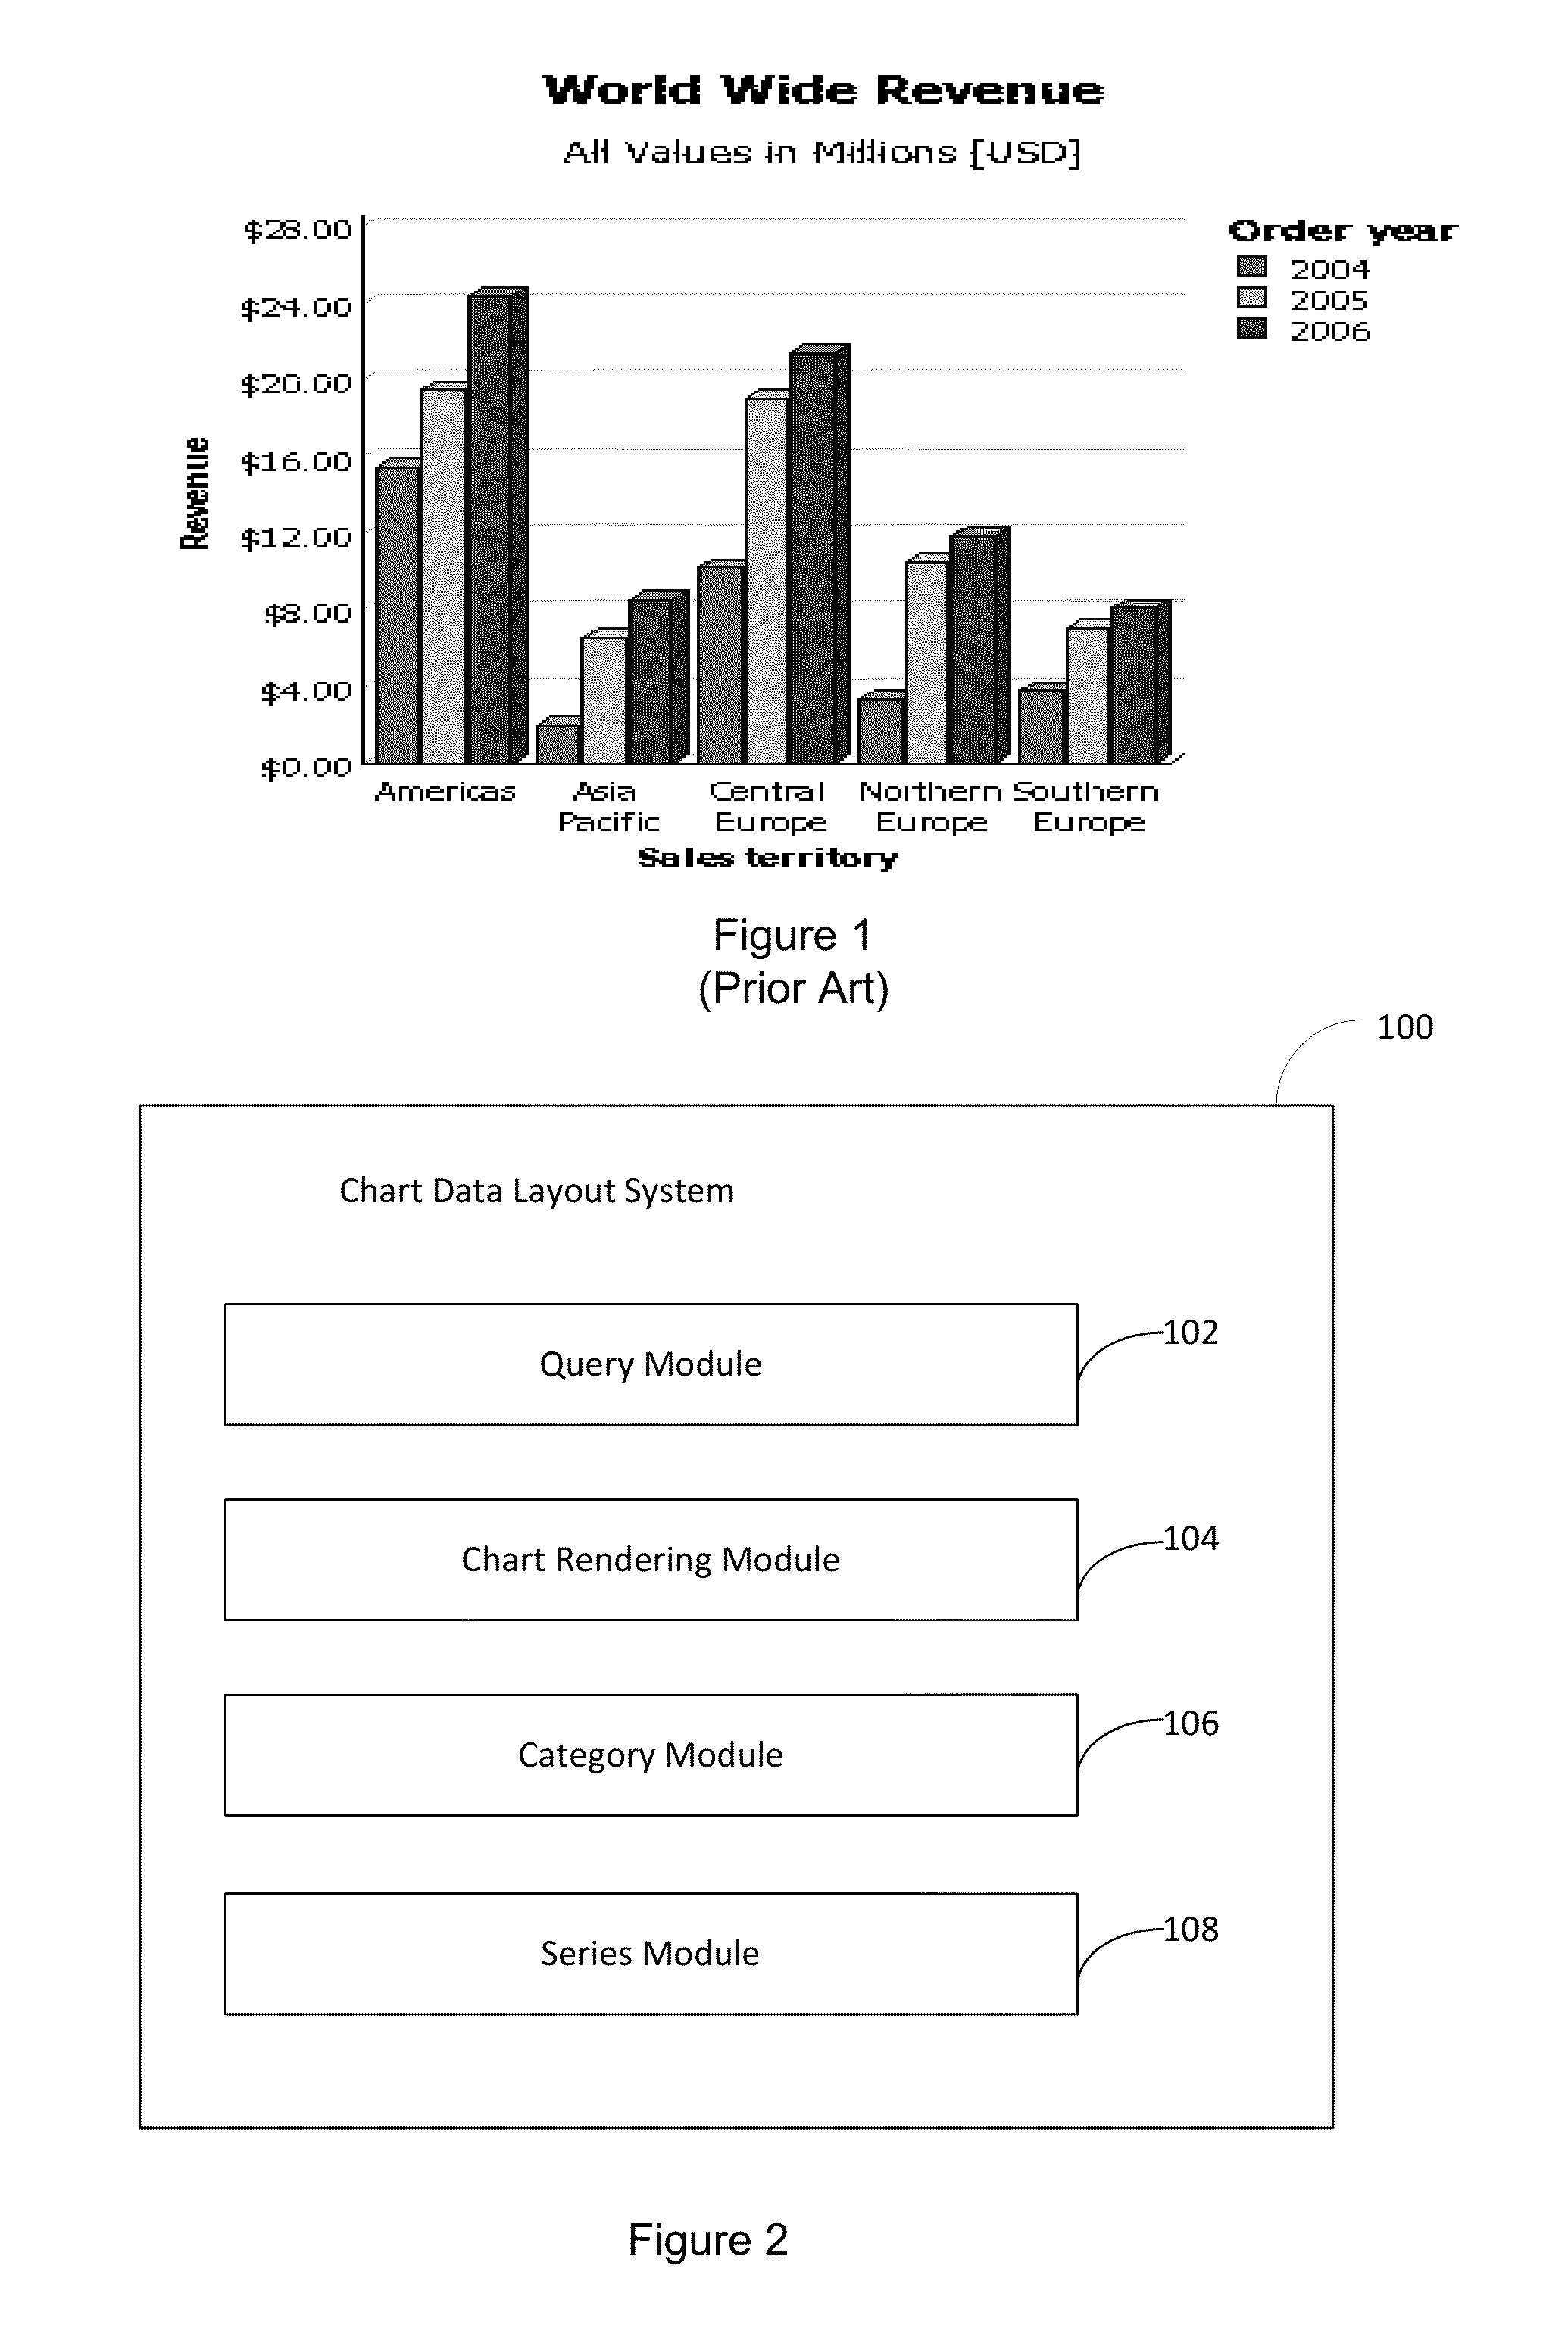
[0017]Charts display information in a graphical manner. They are an effective means to display a large amount of information quickly to a business user. Common types are bar or column charts which show numerical information for category and series information. FIG. 1 is a typical chart that shows revenue for years and location. The data that is shown in this chart is illustrated in Table 1 below:

[0018]

TABLE 1Revenue200420052006Americas$15.41$19.47$24.33Asia Pacific$2.01$6.54$8.53Central Europe$10.21$19.04$21.42Northern Europe$3.34$10.50$11.89Southern Europe$3.78$7.00$8.10

[0019]Consider the case were the business users needs to see the revenue information in the about chart, but also needs to see total revenue for each year, the percentage of revenue each territory contributed to the total and the total revenue for all years and all regions. An example of how this is typically shown is included in FIG. 1. Table 2 shows the basic revenue information in a clear and easy to consume mann...


PUM


Abstract

A chart data layout system and method of processing chart data in a report is provided. An example chart data layout system comprises a query module for decomposing required data into required data queries, a chart layout module for rendering a chart based upon chart data received from the queries, a category module for displaying category aggregate information in a category location of a chart, and a series module for displaying series aggregate information in a series location of the chart. An example method comprises decomposing required data into queries, retrieving queried data, rendering a chart based upon the queried data, rendering category information on a category label of the chart based upon queried data, and rendering series information on a series label of the chart based upon queried data.

Description

FIELD OF INVENTION[0001]The present invention relates to report layouts, and in particular to a system and method of chart data layout.BACKGROUND OF THE INVENTION[0002]Business users need to consume a large amount of information quickly. With limited time to make decisions, they require information in a quick and easy to understand format. FIG. 1 illustrates a typical chart 10 prepared by a business intelligence reporting system. The chart 10 shows revenue for each region and year. However, this chart 10 may not have enough information. The business user may also need to know what the growth was from year to year. They may also require information regarding which territories contributed the most revenue overall.[0003]In the past, business users would have to consume several charts or tables of data to get the information they require. This made the process of understanding the data both time consuming and error prone. Traditional charts are limited in space. They may miss some infor...

Claims


Application Information

Patent Timeline
Patent Type & Authority Patents(United States)
IPC IPC(8): G06T11/20G06F17/30
CPCG06T11/206G06F17/30398G06Q10/10G06F16/2428
Inventor GIBSON, STEPHEN
Owner INT BUSINESS MASCH CORP
Why Eureka
Try Eureka