Displaying pie charts in a limited display area

a limited display area and pie chart technology, applied in the field of reports, can solve the problems of limited precision, difficult to display labels adjacent to each sector, and insufficient display space, and achieve the effect of effective display of pie charts

Inactive Publication Date: 2014-08-19
MELLMO
View PDF21 Cites 9 Cited by
  • Summary
  • Abstract
  • Description
  • Claims
  • Application Information

AI Technical Summary

Problems solved by technology

There are several challenges in trying to show graphs and charts on such devices.
With a limited display area, it may be difficult to display a label adjacent to each sector.
Due to limited display area, only a limited precision of the percent corresponding to each sector may be displayed or there may not be sufficient space to display the percent value.
It is difficult for a viewer to visually distinguish between two sectors that are very similar in size.
It may be difficult to show all the information associated with the data points corresponding to the sectors of the pie chart on a screen with limited display area.
The problem is amplified if the number of sectors in the pie chart is large or if the amount of text to be displayed for the values or the labels is large.

Method used


Image

  • Displaying pie charts in a limited display area
  • Displaying pie charts in a limited display area
  • Displaying pie charts in a limited display area

Examples


Embodiment Construction

[0021]Reference will now be made in detail to several embodiments, examples of which are illustrated in the accompanying figures. It is noted that wherever practicable similar or like reference numbers may be used in the figures and may indicate similar or like functionality. The figures depict embodiments of the disclosed system (or method) for purposes of illustration only. One skilled in the art will readily recognize from the following description that alternative embodiments of the structures and methods illustrated herein may be employed without departing from the principles described herein.

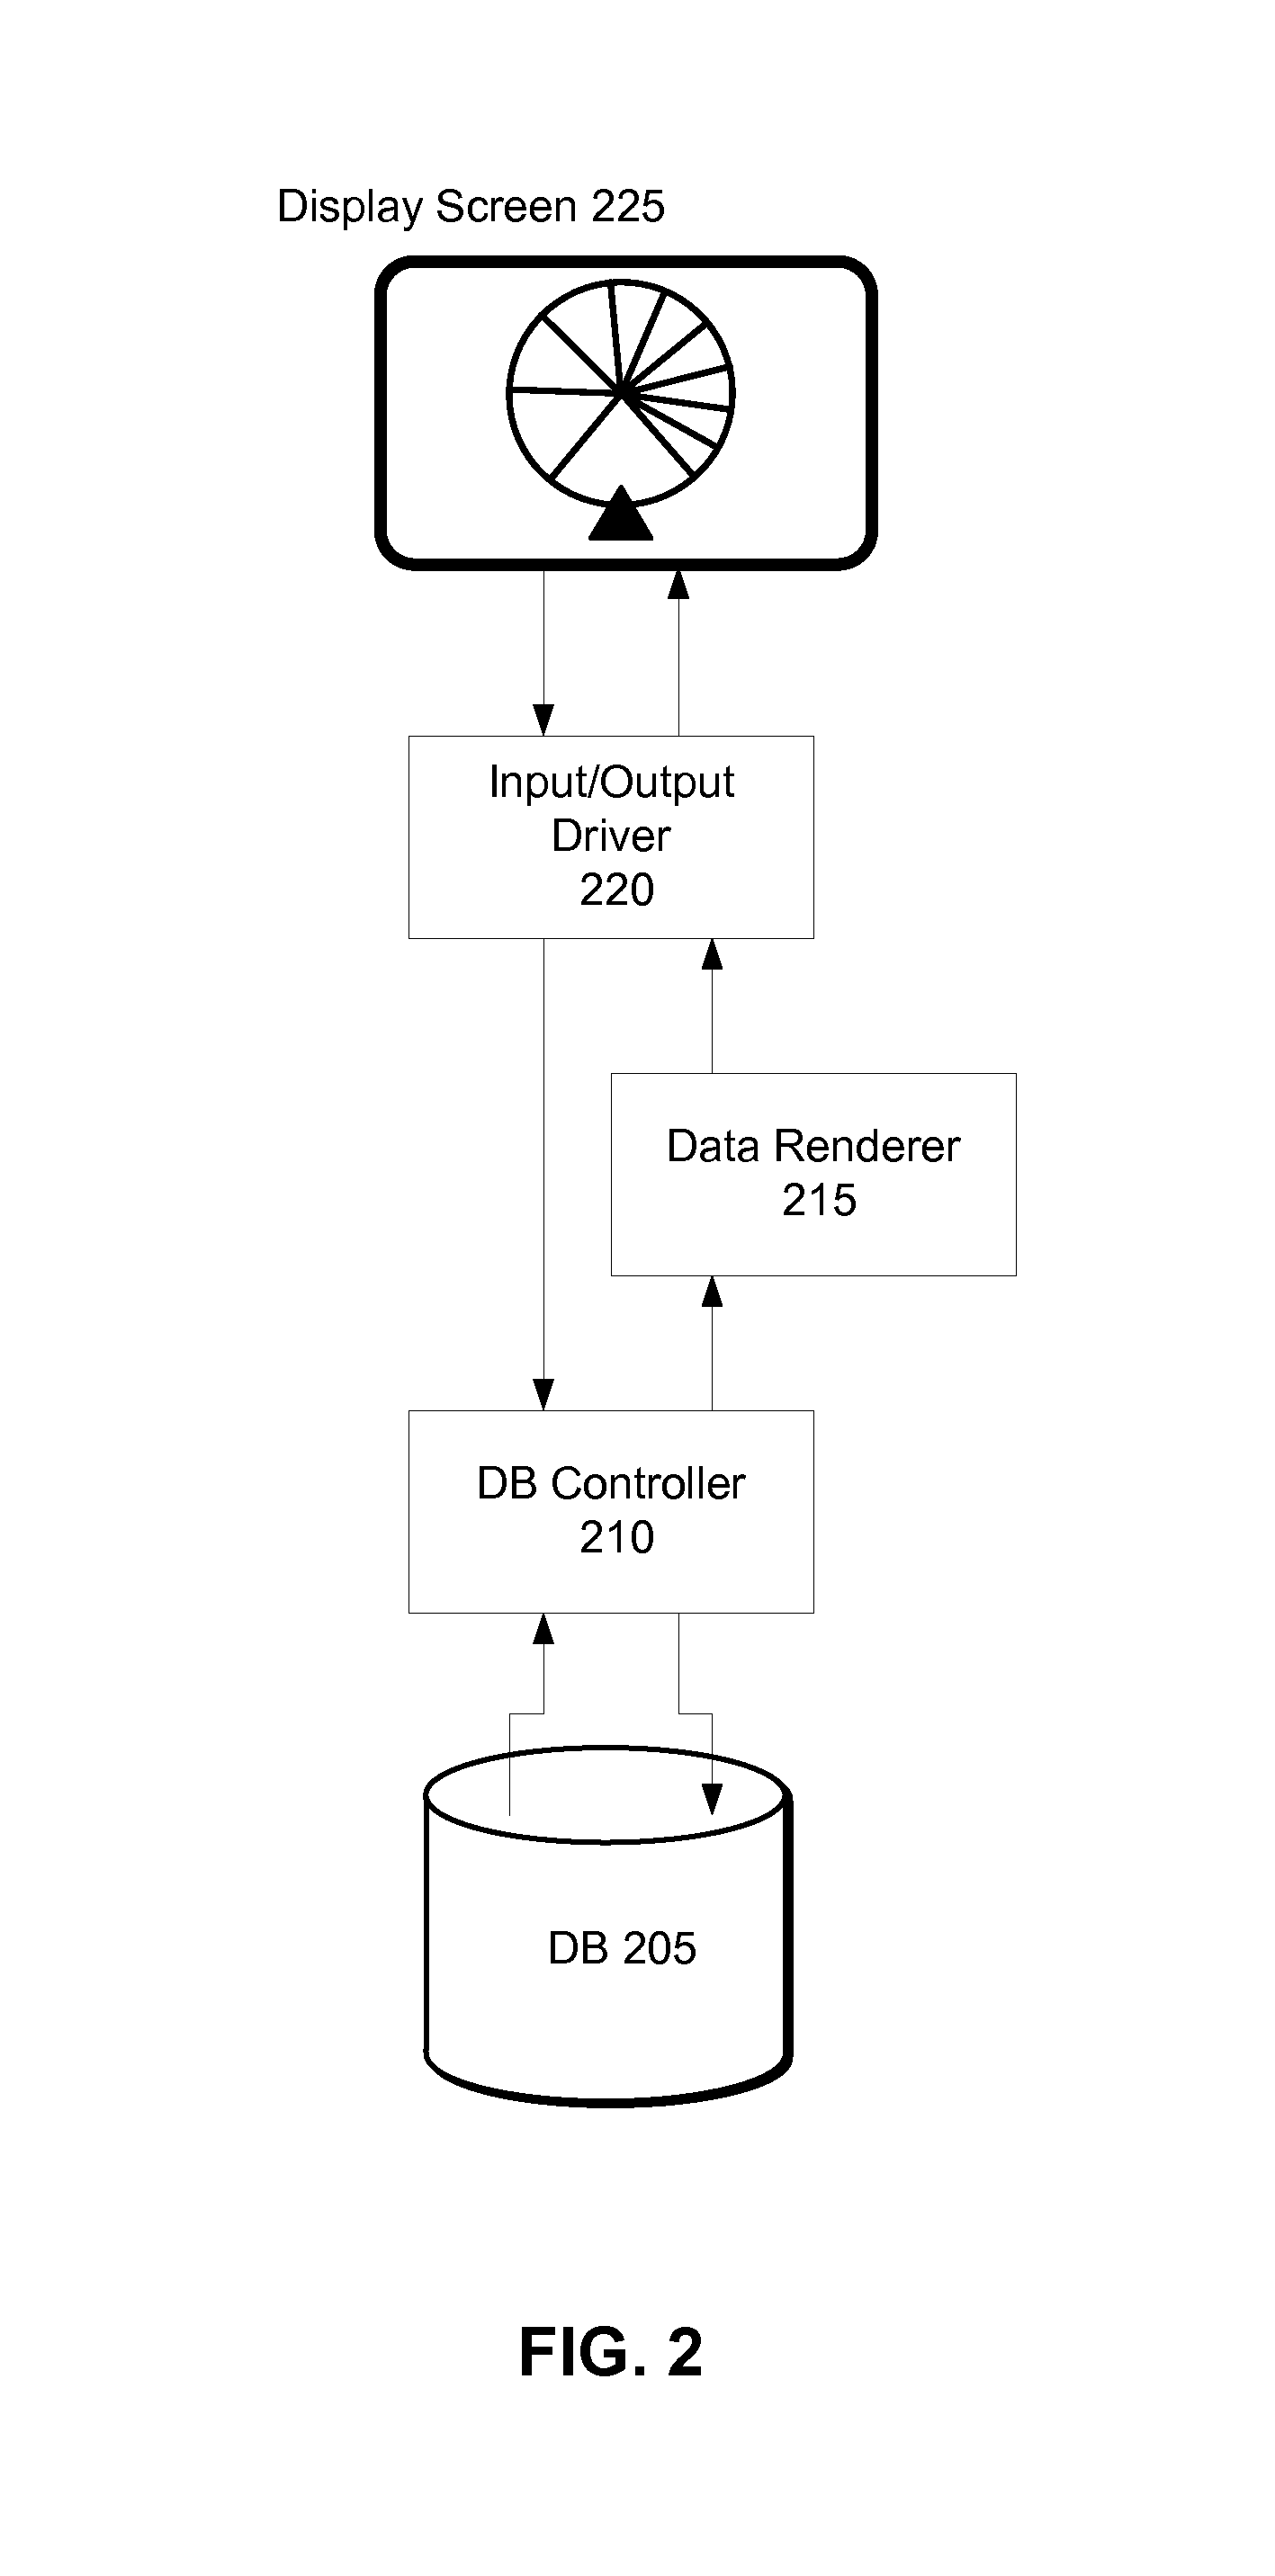
[0022]FIG. 2 is a block diagram of a system architecture in accordance with one embodiment. The components shown in FIG. 2 include a database (DB) 205, a DB controller module 210, a data renderer module 215, an input / output driver module 220 (also referred to as an IO driver module), and a display screen 225. Components such as the display screen 225 are hardware components whereas the DB ...


PUM


Abstract

A system and a method are disclosed for visually displaying data points using pie charts on a display screen with limited display area. Detailed information is presented for individual sectors compared to other sectors displayed. The sector is selected for displaying detailed information based on its orientation with respect to a centerline axis of the chart. The pie chart can be rotated to cause detailed information to be displayed for different sectors. The mechanism is used to display detailed information of data points for other kinds of charts including multi-series pie charts and donut charts.

Description

BACKGROUND[0001]1. Field of Art[0002]The disclosure generally relates to displaying reports on a device having a display area that is small relative to the amount of data that is being displayed.[0003]2. Description of the Related Art[0004]There are several ways of using charts or graphs to visually present statistical data available in reports including, for example, bar charts, pie charts, line graphs, and scatter graphs. On a mobile device such as a handheld device, handheld computer, cell phone, tablet computer, or personal digital assistant (PDA), graphs and charts have to be displayed on small display screens with display areas that are limited in size compared to the data being shown. There are several challenges in trying to show graphs and charts on such devices. For example, FIG. 1 illustrates a pie chart and some of the obstacles encountered in displaying a pie chart on a small screen. Each sector 100 (also referred to as a slice) in a pie chart corresponds to a data poin...

Claims


Application Information

Patent Timeline
Patent Type & Authority Patents(United States)
IPC IPC(8): G06T11/20G06G5/00
CPCG06T11/206
Inventor ALSBURY, QUINTONBECERRA, DAVID
Owner MELLMO
Why Eureka
Try Eureka