Method for realizing three-dimensional pie chart dynamic presentation

A pie chart and three-dimensional technology, applied in the field of dynamic presentation of three-dimensional pie charts, can solve the problems of reducing the use range of pie charts, poor visual effects, poor user experience of pie charts, etc., and achieve the effect of improving user experience

Inactive Publication Date: 2012-11-14
TVMINING BEIJING MEDIA TECH
View PDF5 Cites 5 Cited by
  • Summary
  • Abstract
  • Description
  • Claims
  • Application Information

AI Technical Summary

Problems solved by technology

However, the pie charts currently used are relatively monotonous in presentation and have poor visual e...

Method used


Image

  • Method for realizing three-dimensional pie chart dynamic presentation
  • Method for realizing three-dimensional pie chart dynamic presentation
  • Method for realizing three-dimensional pie chart dynamic presentation

Examples


Embodiment Construction

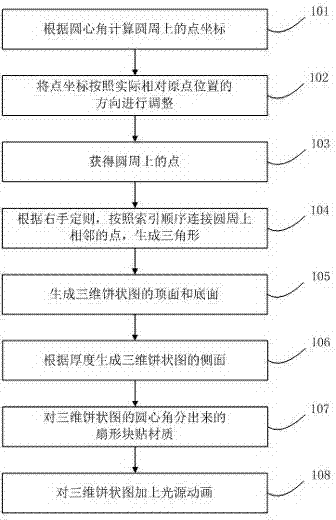
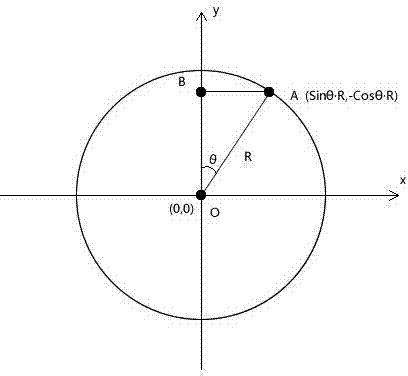
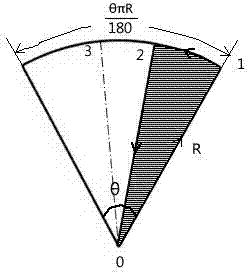
[0025] The technical solutions of the present invention will be further described below in conjunction with the accompanying drawings and through specific implementation methods.

[0026] The main idea of ​​the technical solution of the present invention is to use the 3D rendering technology in WPF to realize the three-dimensional pie chart. First, describe the basis for realizing the 3D interface. The basic idea of ​​generating 3D graphics is to obtain a three-dimensional model (Model) of an object. Since the screen is only two-dimensional, a camera (Camera) for taking pictures of objects is defined. The photos taken are actually the projection of the object onto a flat surface. This projection is rendered into a bitmap by the 3D rendering engine. The engine calculates all The amount of light reflected by the light source on the projection surface of the object in the 3D space determines the color of each pixel in the bitmap.

[0027] Each surface of an object has a material...


PUM


Abstract

The invention discloses a method for realizing three-dimensional pie chart dynamic presentation. The method comprises the following steps of: calculating point coordinates on the circumference according to a central angle; adjusting the point coordinates according to the actual direction relative to the origin position; obtaining points on the circumference with indexes from 1 to n, wherein n is a natural number; sequentially connecting adjacent points on the circumference according to the indexes based on the right-hand rule to generate a triangle; generating the top surface and bottom surface of a three-dimensional pie chart in the mode; and generating the side surface of the three-dimensional pie chart according to the thickness. Through the technical scheme, the pie chart can be dynamically represented in a three-dimensional mode so as to provide a better visual effect and a unique user experience.

Description

technical field [0001] The invention relates to the technical field of new media, in particular to a method for realizing dynamic presentation of a three-dimensional pie chart. Background technique [0002] In the field of new media, there are more and more demands for interactive broadcasting in studios, government meeting reports, and interactive displays in museums, science and technology museums and exhibition halls, and pie charts are often used. However, the currently used pie charts are relatively monotonous in presentation and have poor visual effects, which leads to poor user experience of the pie charts and reduces the scope of use of the pie charts. Contents of the invention [0003] The purpose of the present invention is to propose a method for realizing the dynamic presentation of a three-dimensional pie chart, which can dynamically present the pie chart in a three-dimensional manner, thereby providing better visual effects and unique user experience. [000...

Claims


Application Information

Patent Timeline
IPC IPC(8): G06T17/10
CPCG06T11/206G06T17/10
Inventor 呼伦夫
Owner TVMINING BEIJING MEDIA TECH
Why Eureka
Try Eureka