
Extracting insightful nodes from graphs

a graph and node technology, applied in the field of graph analysis, can solve the problems of many analysts failing to discover useful insights buried in graphs, difficult for humans to interpret graphs, and massively exceeding human cognition's capabilities,

Active Publication Date: 2017-10-10
QUID LLC
View PDF23 Cites 40 Cited by
  • Summary
  • Abstract
  • Description
  • Claims
  • Application Information

AI Technical Summary

Benefits of technology

The patent describes a process for creating a graph of data and identifying nodes with anomalous values. The process can help identify patterns or relationships in the data. The technical effect of this patent is to provide a way to analyze data in a more efficient and effective way.

Problems solved by technology

Such graphs, however, can be difficult for humans to interpret, as the amount of information contained can massively exceed the capabilities of human cognition.
Lacking adequate tools for synthesizing knowledge from such data structures, many analysts fail to discover useful insights buried in graphs.

Method used


Image

  • Extracting insightful nodes from graphs
  • Extracting insightful nodes from graphs
  • Extracting insightful nodes from graphs

Examples


embodiment 1

2. The method of embodiment 1, wherein: the graph comprises more than 5,000 nodes and more than 10 clusters; the node attributes comprise: more than 4 non-edge attributes; and more than 2 edge attributes; obtaining a designation of a given node attribute from among the plurality of node attributes comprises: determining mean values of each of the node attributes for each of the clusters; determining sizes of each of the clusters; determining distributions of mean values of each of the attributes for random samplings of the size of the clusters from among nodes of the graph, including nodes outside the respective cluster; based on the distributions, selecting attributes that have mean values that have probabilities in the distributions of less than a threshold amount, wherein different attributes are selected for different clusters; sending instructions comprises sending instructions to display a force directed layout of clusters of the graph with cluster icons representing the respe...

embodiment 3

4. The method of embodiment 3, wherein the nodes represent documents and wherein the attributes comprise: an amount of times the respective document was shared between users.

5. The method of embodiment 3, wherein the nodes represent businesses and wherein the attributes comprise: a metric of the respective business's performance.

6. The method of any of embodiments 1-5, wherein at least some of the node attributes are values indicating properties of edges connected to the respective node.

embodiment 6

7. The method of embodiment 6, wherein the properties of edges include an amount of edges having greater than a threshold edge weight.

8. The method of embodiment 6, wherein the properties of edges include an amount of edges extending between clusters of the nodes.

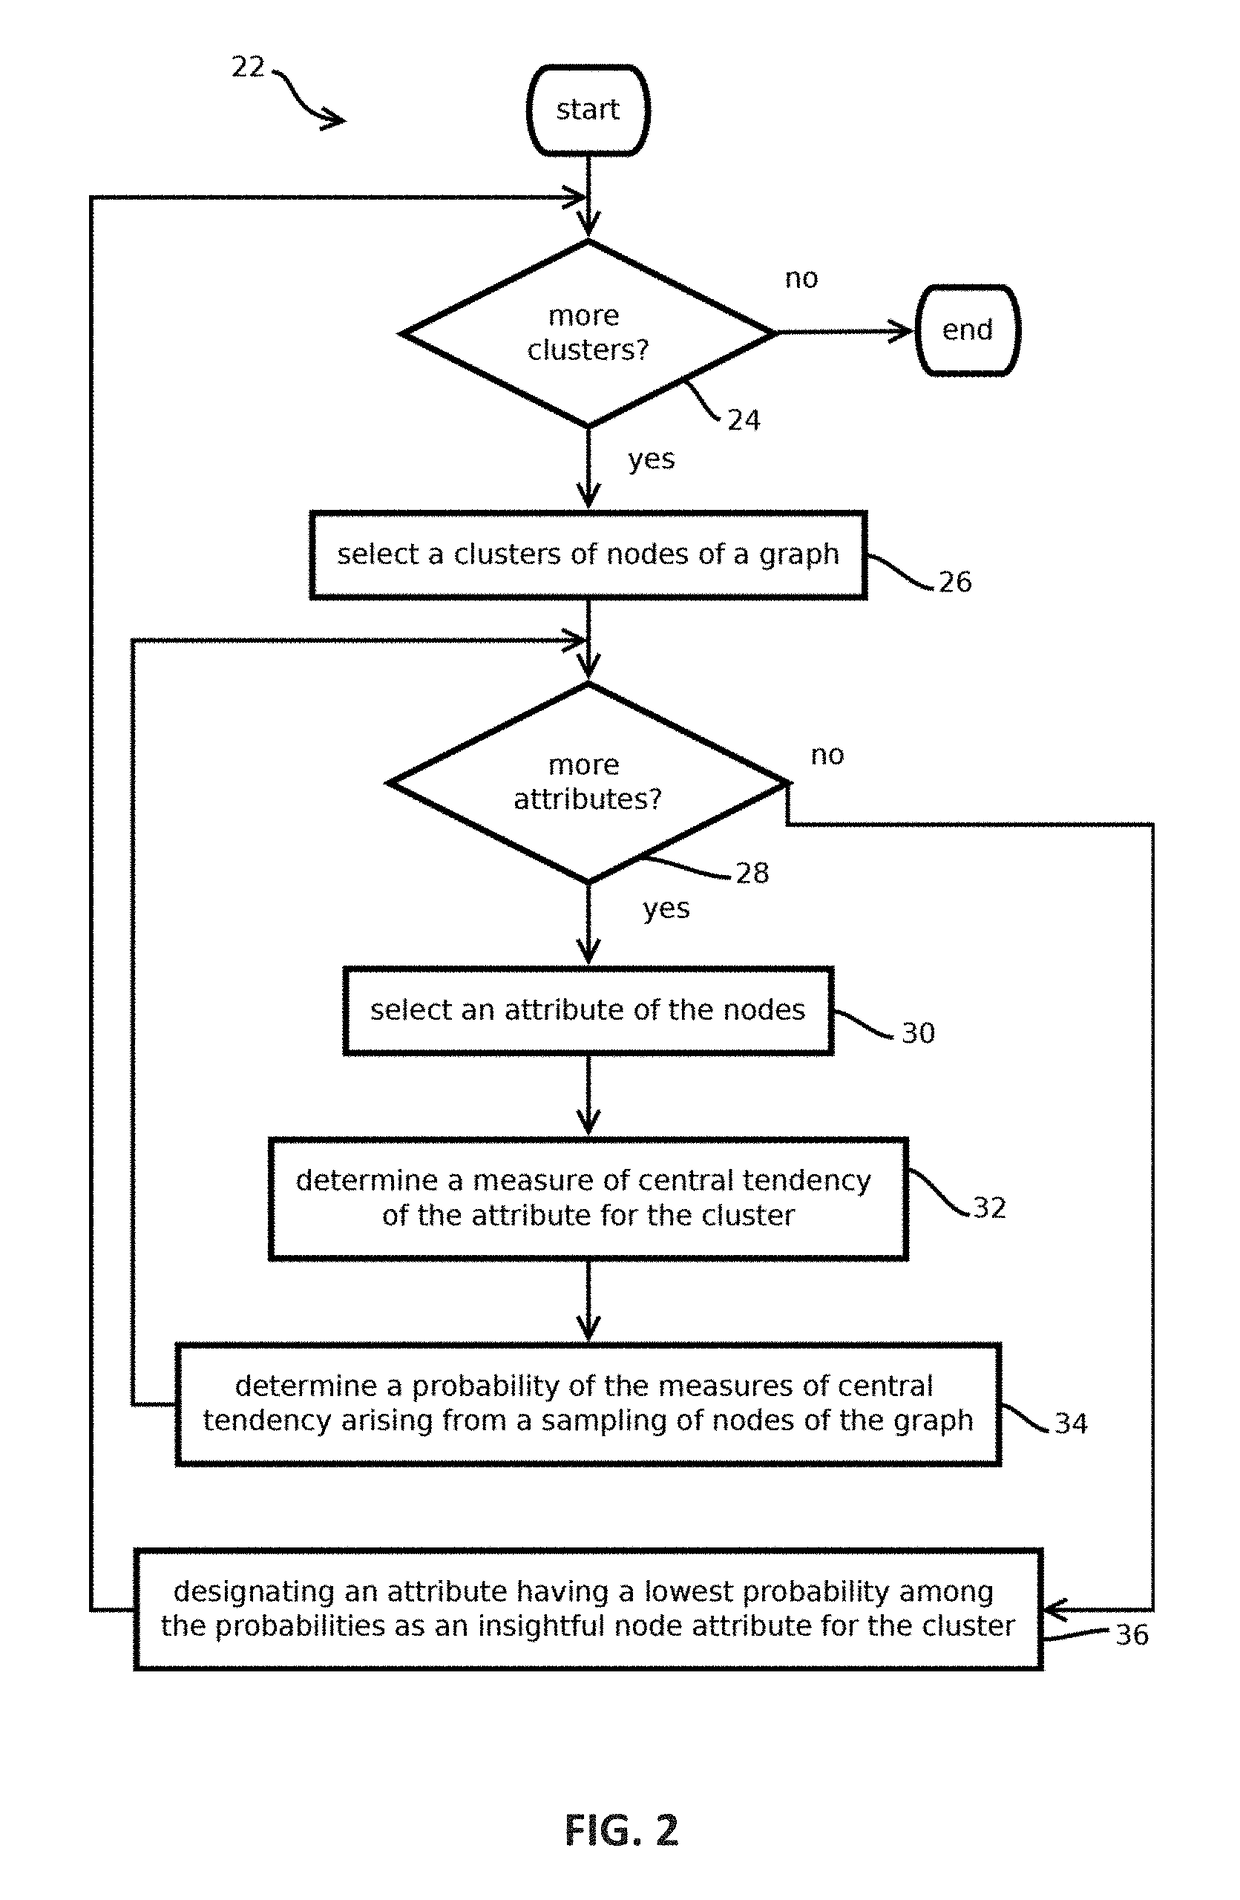
9. The method of any of embodiments 1-8, wherein obtaining a designation of a given node attribute from among the plurality of node attributes comprises: selecting a cluster from a plurality of clusters of nodes of the graph; determining measures of central tendency for each of a plurality of attributes of the nodes of the selected cluster; determining, based at least in part on nodes outside the selected cluster, probabilities of each of the measures of central tendency arising from a sampling of nodes of the graph; and designating an attribute having a lowest probability among the probabilities as the given node attribute.


PUM


Abstract

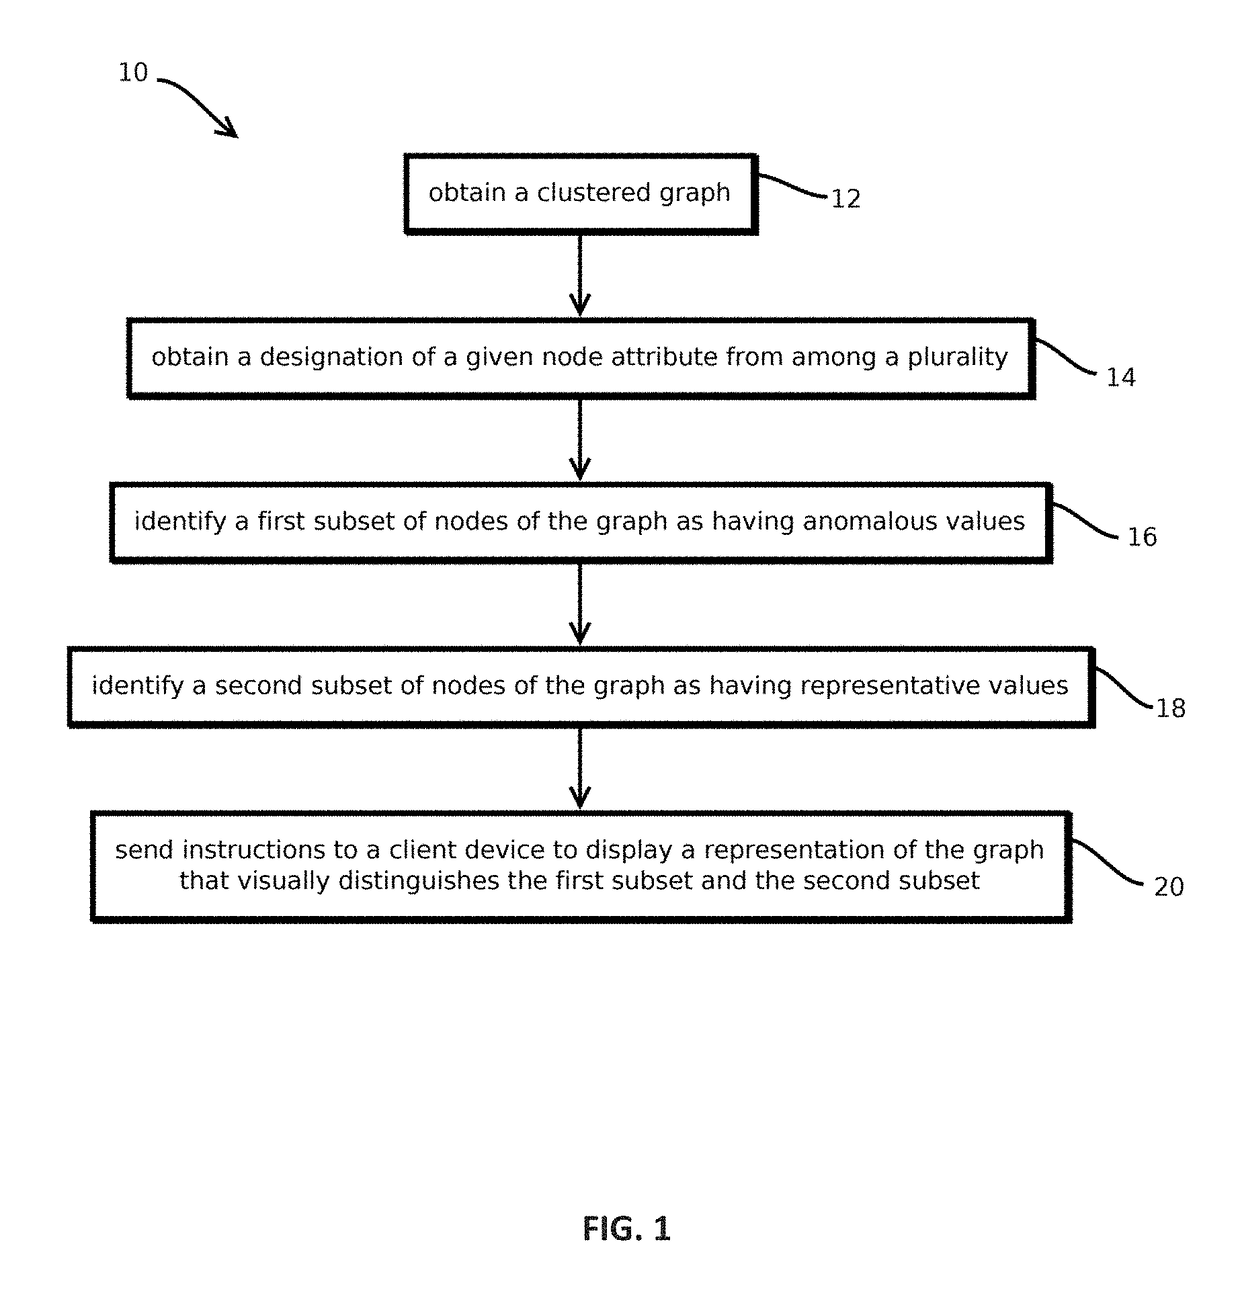
Provided is a process, including: obtaining a clustered graph, wherein each of the nodes has a plurality of respective node attributes other than an identifier of the node; obtaining a designation of a given node attribute from among the plurality of node attributes; identifying a first subset of nodes of the graph as having anomalous values of the given node attribute by comparing values of the given node attribute in the first subset to a distribution of the given node attribute; identifying a second subset of nodes of the graph as having representative values of the given node attribute by comparing values of the given node attribute in the second subset to the distribution of the given node attribute; and sending instructions to a client device to display a representation of the graph.

Description

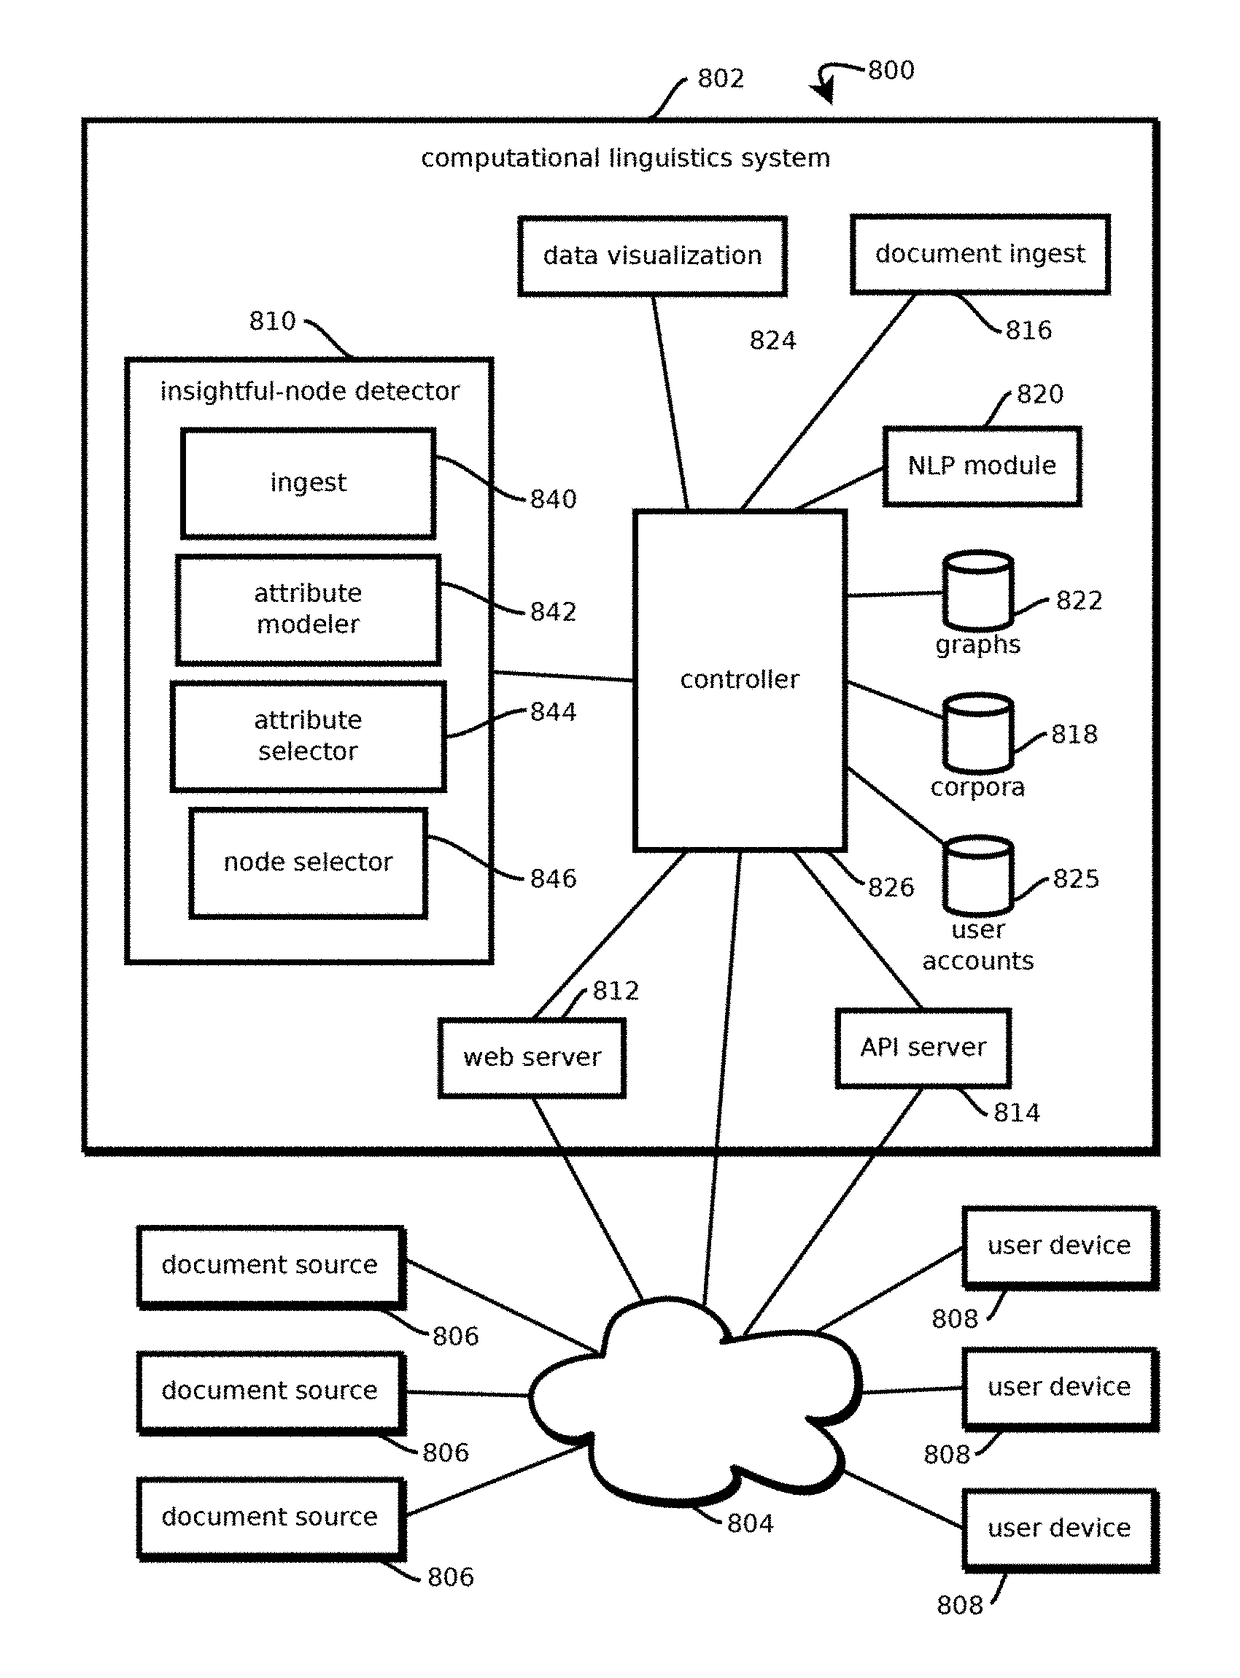
BACKGROUND[0001]1. Field[0002]The present disclosure relates generally to graph analysis and, more specifically, to automatically extracting insightful nodes from graphs.[0003]2. Description of the Related Art[0004]Graphs are powerful data models for understanding systems in which relationships between entities are important. Examples include graphs characterizing relationships between documents, like semantic similarity between each document in a corpus, such as news articles published in a given decade, or between websites, or between scientific journal articles. Other examples include graphs characterizing relationships between other entities, like between companies, countries, or people, such as graphs relating exchanges there between or similarities there between.[0005]Such graphs, however, can be difficult for humans to interpret, as the amount of information contained can massively exceed the capabilities of human cognition. Many typical applications have well in excess of 1,...

Claims


Application Information

Patent Timeline
IPC IPC(8): G06F11/00G06F17/30H04L29/06
CPCH04L63/1425G06F17/30713G06F17/30958G06F16/9024G06F16/358G06Q30/0201
Inventor LOVE, ORIANA JEANNETTETACCHI, RUGGERO ALTAIRCHEN, PING
Owner QUID LLC
Learn More