A method for stratified damage analysis of rock
A technology for rock and rock samples, applied in the field of layered damage analysis of rocks, which can solve the problems of inaccurate results and inability to obtain CT average values, and achieve the effects of simple operation, narrowing the damage range and saving operation time.
- Summary
- Abstract
- Description
- Claims
- Application Information
AI Technical Summary
Problems solved by technology
Method used
Image
Examples
Embodiment 1
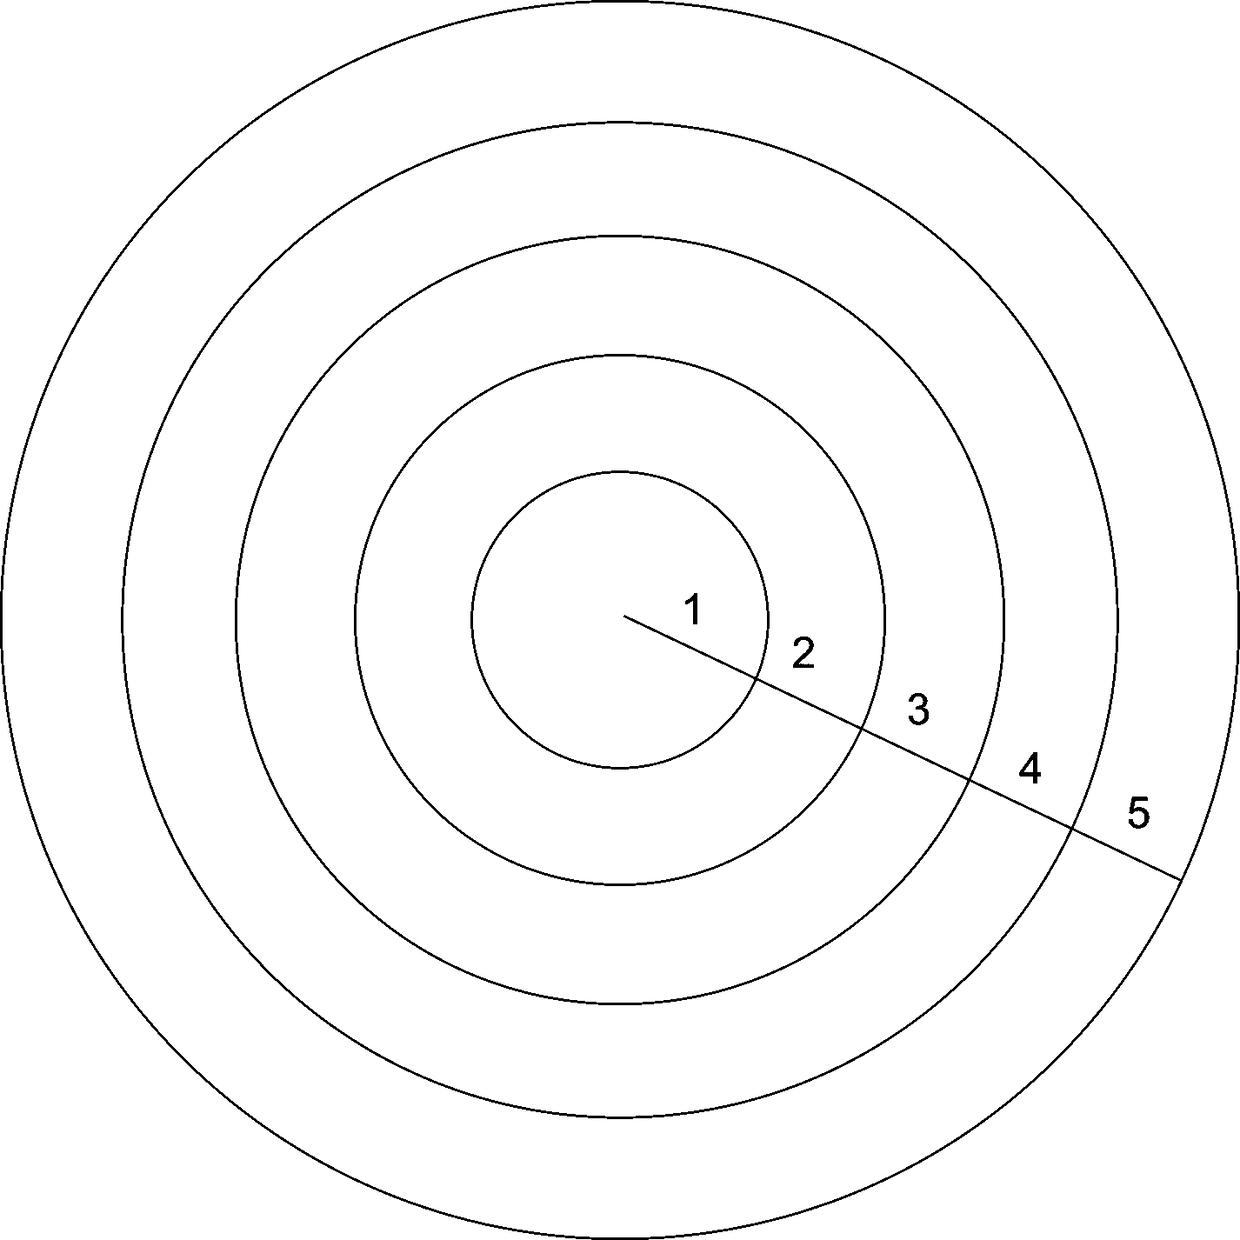
[0034] Step 1: The rock sample is a cylindrical rock sample with a radius of 2.5 cm, select a certain cross-section on the rock sample, and divide the cross-section into regions: starting from the center point of the cross-section, divide 5 equal The sample rings with radius difference are marked as the first sample ring, the second sample ring, the third sample ring, the fourth sample ring, and the fifth sample ring. The radius difference is 0.5 cm, such as figure 1 shown;
[0035] Step 2: Calculate the mean value CT of the CT of each ring in the initial state Tave(N) : Perform an initial CT scan on the circle where each sample ring is located, and obtain the CT value of the circle where each sample ring is located 1初始 , CT 2初始 , CT 3初始 …CT N初始 , measuring the area of the circle where each sample ring is located is S 1 , S 2 , S 3 …S N ,
[0036] CT mean CT of various rings in the initial state Tave(N)初始 =(CT N -CT N-1 ) / (S N -S N-1 )
[0037] N=5;
[0038] ...
Embodiment 2
[0053] The method also includes step 5:
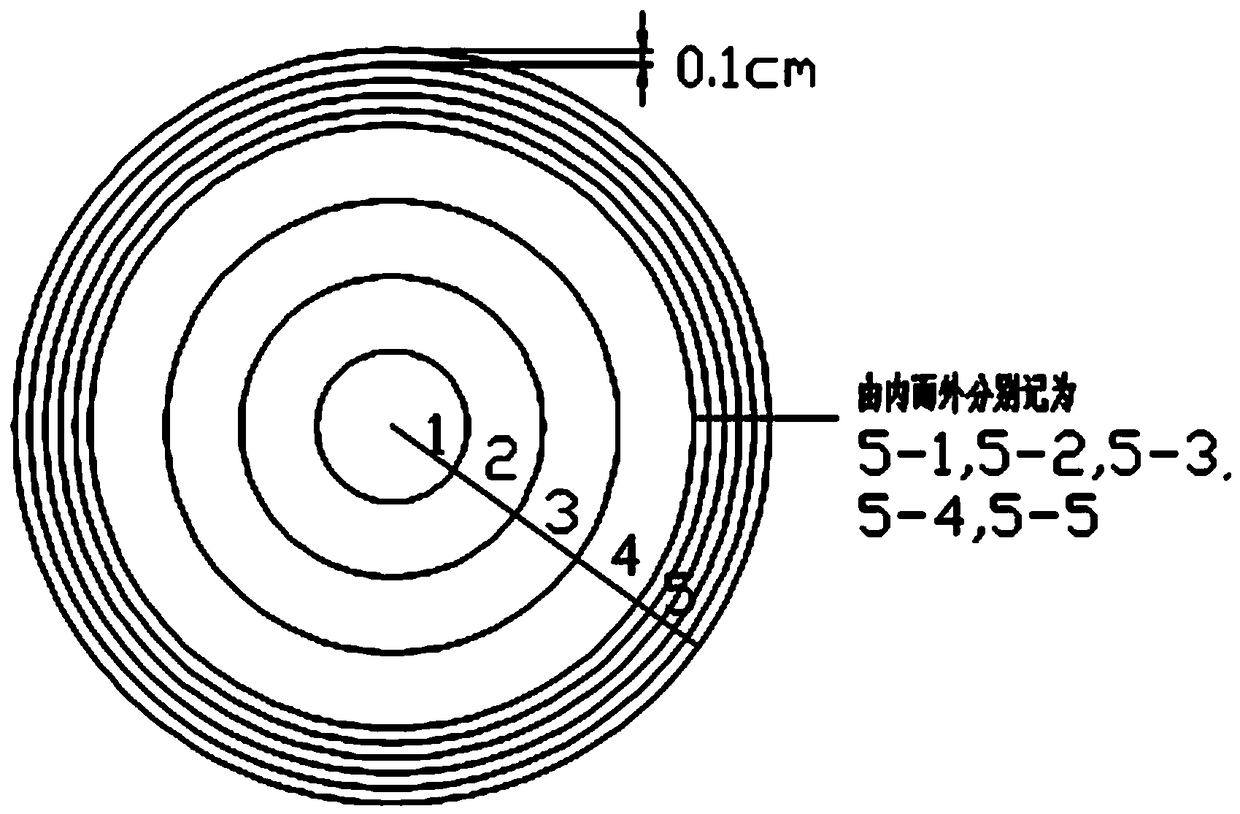
[0054] Step 5: The fifth sample ring where the damage of the freeze-thaw cycle obtained in step 4 is mainly concentrated to the rock is divided into regions again, and starting from the central point of the cross section, the concentrated parts of the damage are divided into M (M=5 ) sample rings with equal radius difference, which are respectively the 5-1 sample ring, the 5-2 sample ring, the 5-3 sample ring, the 5-4 sample ring and the 5-5 sample ring, such as image 3 As shown, the radius difference is 0.1 cm; then according to the steps 2-4 of the above-mentioned embodiment 1, the data sorted out are as shown in Table 3:
[0055] table 3
[0056]
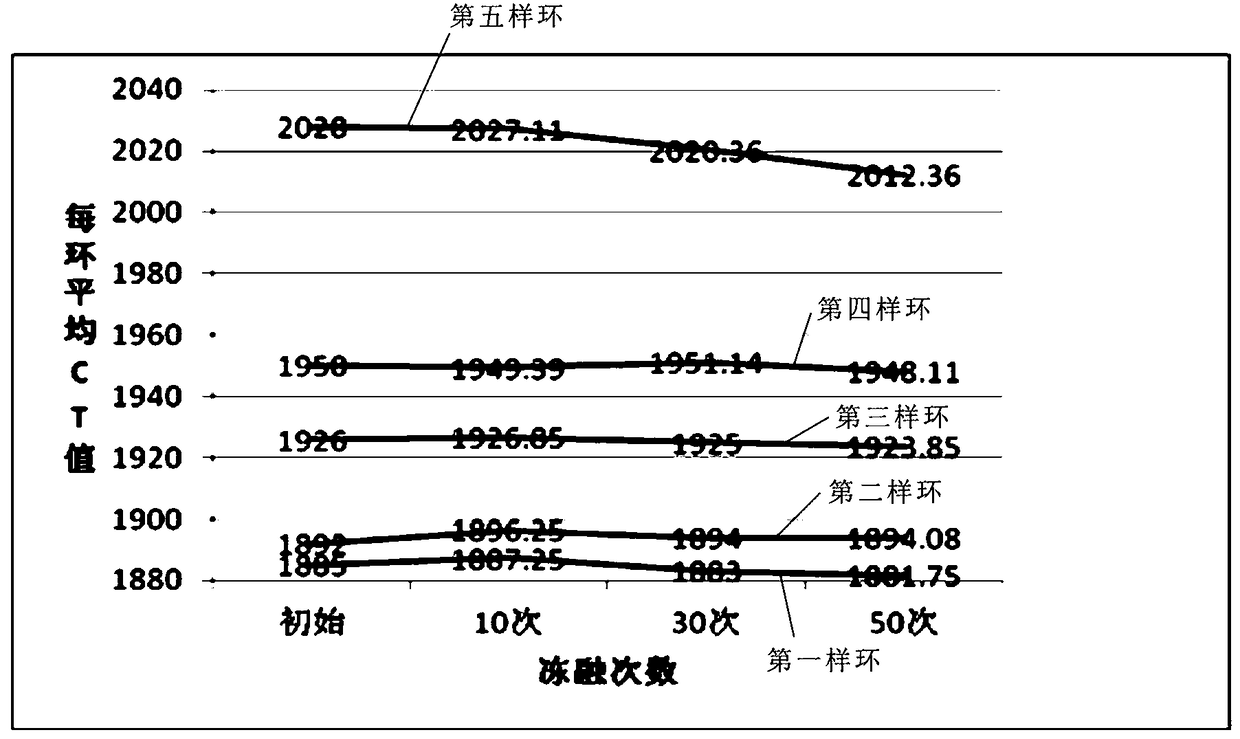
[0057] According to the data in Table 3, the average CT value of each sample ring-freeze-thaw cycle experiment number curve is made, such as Figure 4 shown, from Figure 4 It can be seen from the figure that the CT value of the 5th-5th sample ring has the most obvious change range...
Embodiment 3
[0060] The sample ring can also be designed as a rectangle, and n sample rings with equal radius differences are divided for the rock sample with a rectangular cross section, such as Figure 5 Shown, analyze according to the step of above-mentioned embodiment one and two.
PUM
 Abstract
Description
Claims
Application Information
 - R&D
- Intellectual Property
- Life Sciences
- Materials
- Tech Scout
- Unparalleled Data Quality
- Higher Quality Content
- 60% Fewer Hallucinations
Browse by: Latest US Patents, China's latest patents, Technical Efficacy Thesaurus, Application Domain, Technology Topic, Popular Technical Reports.
© 2025 PatSnap. All rights reserved.Legal|Privacy policy|Modern Slavery Act Transparency Statement|Sitemap|About US| Contact US: help@patsnap.com


