
A Visualization Method of Spatial-Temporal Delay Correlation

A correlation, space-time technology, applied in the field of information visualization, can solve problems such as auxiliary analysis of delay correlation of difficult and multiple time series data

Active Publication Date: 2020-04-21
COMP NETWORK INFORMATION CENT CHINESE ACADEMY OF SCI
View PDF3 Cites 0 Cited by
  • Summary
  • Abstract
  • Description
  • Claims
  • Application Information

AI Technical Summary

Problems solved by technology

[0005] However, there is currently no good method for visualizing multi-time series data with spatial relationships, and it is difficult to assist analysis of the delay correlation of multi-time series data with spatial relationships through less visualization methods

Method used


Image

  • A Visualization Method of Spatial-Temporal Delay Correlation
  • A Visualization Method of Spatial-Temporal Delay Correlation
  • A Visualization Method of Spatial-Temporal Delay Correlation

Examples


Embodiment Construction

[0035] In order to make the above objects, features and advantages of the present invention more obvious and understandable, the present invention will be further described below through specific embodiments and accompanying drawings.

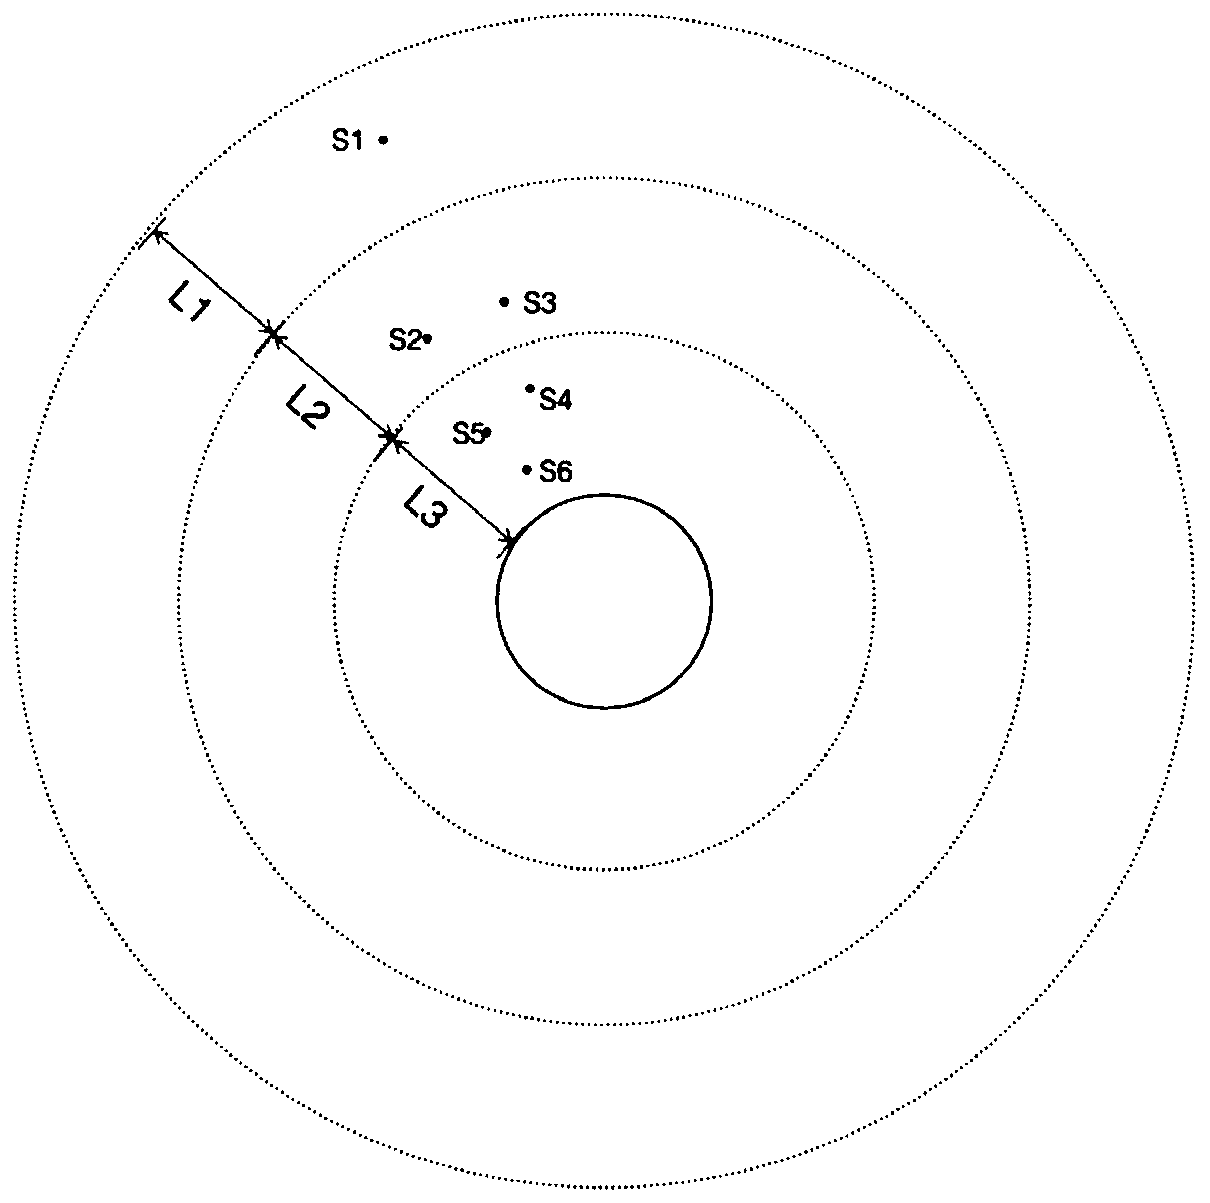
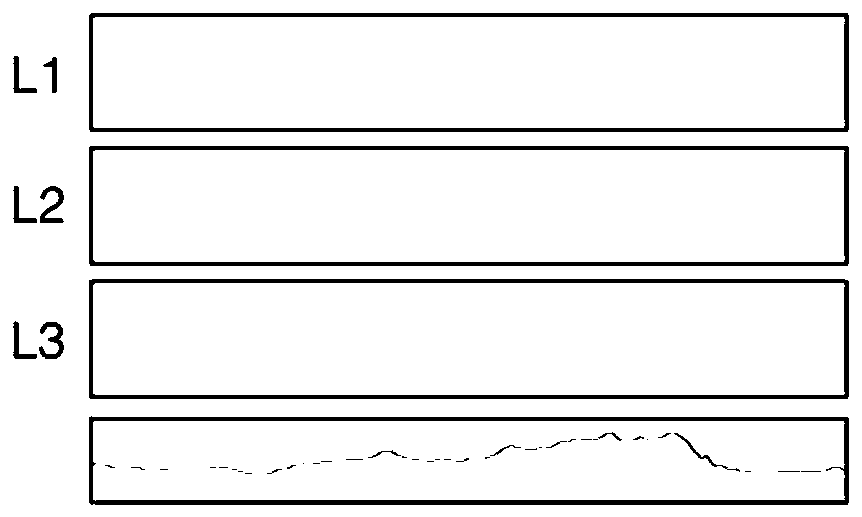
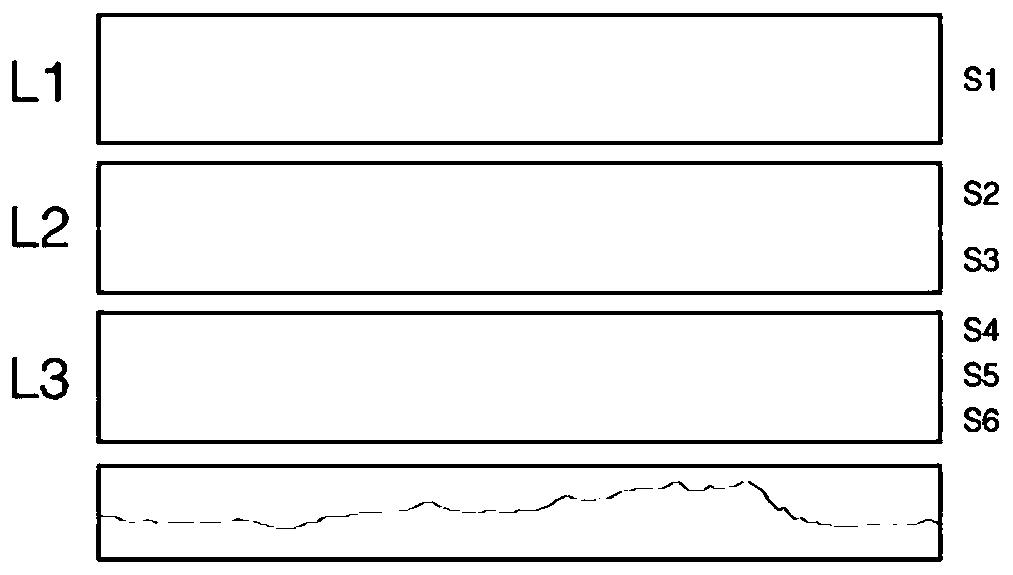
[0036] The present invention is based on the visualization method based on rectangular blocks, through continuous rectangular blocks of different color mapping, the correlation of each different delay time is represented; through hierarchical division, and rectangular strips (multiple Rectangular block) distance map to represent the correlation of sites with different spatial relationships.

[0037] 1. Data preparation

[0038] a. The present invention is directed to multi-time series data with spatial relationships. For the spatial location of a selected time-series data, calculate the distance between the spatial location of other time-series data and the location.

[0039] b. Select the time series data of a certain site S and the correspo...


PUM


Abstract

The invention relates to a spatiotemporal delay correlation visualization method. The method comprises the steps of representing a correlation of different delay time through continuous rectangular blocks mapped by different colors based on a rectangle-based visualization method; and representing a correlation of sites with different spatial relationships through hierarchical division and distance mapping of rectangular bands (a plurality of rectangular blocks corresponding to each site). Through the method, the delay correlation of multiple pieces of time series data with spatial relationships can be visualized, thereby assisting an analyst to discover a causal relationship implied in the correlation.

Description

technical field [0001] The invention provides a time-space delay correlation visualization method, which can visualize and assist analysis of the delay correlation of a plurality of time series data with a spatial relationship, and belongs to the field of information visualization. Background technique [0002] Spatiotemporal data refers to data with time and space tags. With the popularization of sensor technology, the amount of spatiotemporal data has increased dramatically. Through the analysis of spatio-temporal data, trends and anomalies in the data can be found. The visualization method presents the data in an intuitive way, which is very helpful for understanding the information behind the complex data. [0003] Site-based spatio-temporal data refers to the data that the data collection device is fixed at certain specific locations and changes over time, such as ground-based air quality monitoring sites, temperature sensors in office areas, etc. The spatial tags con...

Claims


Application Information

Patent Timeline
Patent Type & Authority Patents(China)
IPC IPC(8): G06F16/26
CPCG06F16/26
Inventor 杜一周园春黎建辉
Owner COMP NETWORK INFORMATION CENT CHINESE ACADEMY OF SCI
Learn More