Method and system for combined display of town-level boundary coordinate data and charts

A technology of coordinate data and data structure, applied in the field of big data, can solve the problems of not meeting business, system, not finding professional town boundary data display and statistical chart platform system, not providing map boundary display service, etc.

Inactive Publication Date: 2017-08-18
GUANGDONG SCI & TECH INFRASTRUCTURE CENT
View PDF4 Cites 4 Cited by
  • Summary
  • Abstract
  • Description
  • Claims
  • Application Information

AI Technical Summary

Problems solved by technology

[0003] In the existing technology, many maps do not provide map boundary display services at the township street level, and there is no platform system that combines professional town boundary data display with statistical charts. Therefore, the cur

Method used


Image

  • Method and system for combined display of town-level boundary coordinate data and charts
  • Method and system for combined display of town-level boundary coordinate data and charts
  • Method and system for combined display of town-level boundary coordinate data and charts

Examples


Embodiment Construction

[0078] In order to more clearly illustrate the technical solutions in the embodiments of the present invention, the following will briefly introduce the accompanying drawings that need to be used in the embodiments. Obviously, the accompanying drawings in the following description are only some embodiments of the present invention. For Those of ordinary skill in the art can also obtain other drawings based on these drawings without making creative efforts.

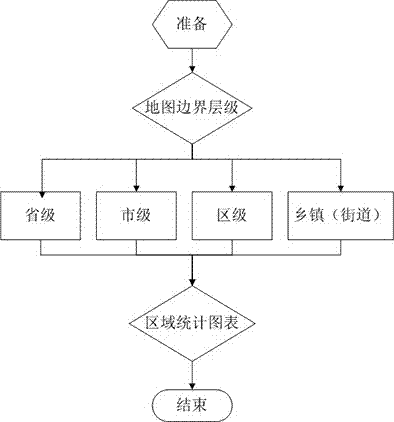
[0079] The invention provides a method for displaying town-level boundary coordinate data and charts in combination, figure 1 It is a flow chart of the method operation steps of the present invention, such as figure 1 shown;

[0080] Step 101, read the parameter information of the province, city, and district through the display interface of the map boundary area;

[0081] This platform realizes the display and query function of province, city, district, and town-level boundaries. Different levels of the map display differ...


PUM


Abstract

The invention discloses a method and a system for combined display of town-level boundary coordinate data and charts. Through the method and the system, a provincial, municipal, district-level and town-level boundary display query function is achieved, and different levels in a map display different level boundaries including provincial boundaries, municipal boundaries, district-level boundaries and town-level boundaries, wherein the provincial boundaries, the municipal boundaries and the district-level boundaries are directly displayed through a Baidu map boundary region display interface. Through the technical scheme, town/street-level map boundary display service in a map is realized, and a professional town boundary coordinate data display and statistical chart display combination method is provided.

Description

technical field [0001] The present invention relates to the technical field of big data, in particular to a method and system for combining and displaying town-level boundary coordinate data and graphs. Background technique [0002] In the current computer market, the number of operators providing map services continues to increase, and the map services on the Internet are also continuously enriched. However, in the current map business that provides services online, there is no map boundary display service at the township street level, and there is no method to combine professional town boundary coordinate data display with statistical charts. More map services are methods for displaying data boundaries at the national, provincial, municipal, and district levels. Various map companies have these methods, such as Baidu Maps, AutoNavi Maps, and Google Maps. These map boundary services are displayed using the boundary display method independently developed by the map company....

Claims


Application Information

Patent Timeline
IPC IPC(8): G06F17/30
CPCG06F16/248G06F16/29G06F16/9537
Inventor 苏炜李正权赵昌平
Owner GUANGDONG SCI & TECH INFRASTRUCTURE CENT
Why Eureka
Try Eureka