

Smart phone network data collecting and analyzing system and method capable of collecting real scence
A data collection and well-informed technology, applied in the field of telecommunications, can solve problems such as lack of environmental data
- Summary
- Abstract
- Description
- Claims
- Application Information
AI Technical Summary
Problems solved by technology
Method used
Image

Examples
Embodiment Construction
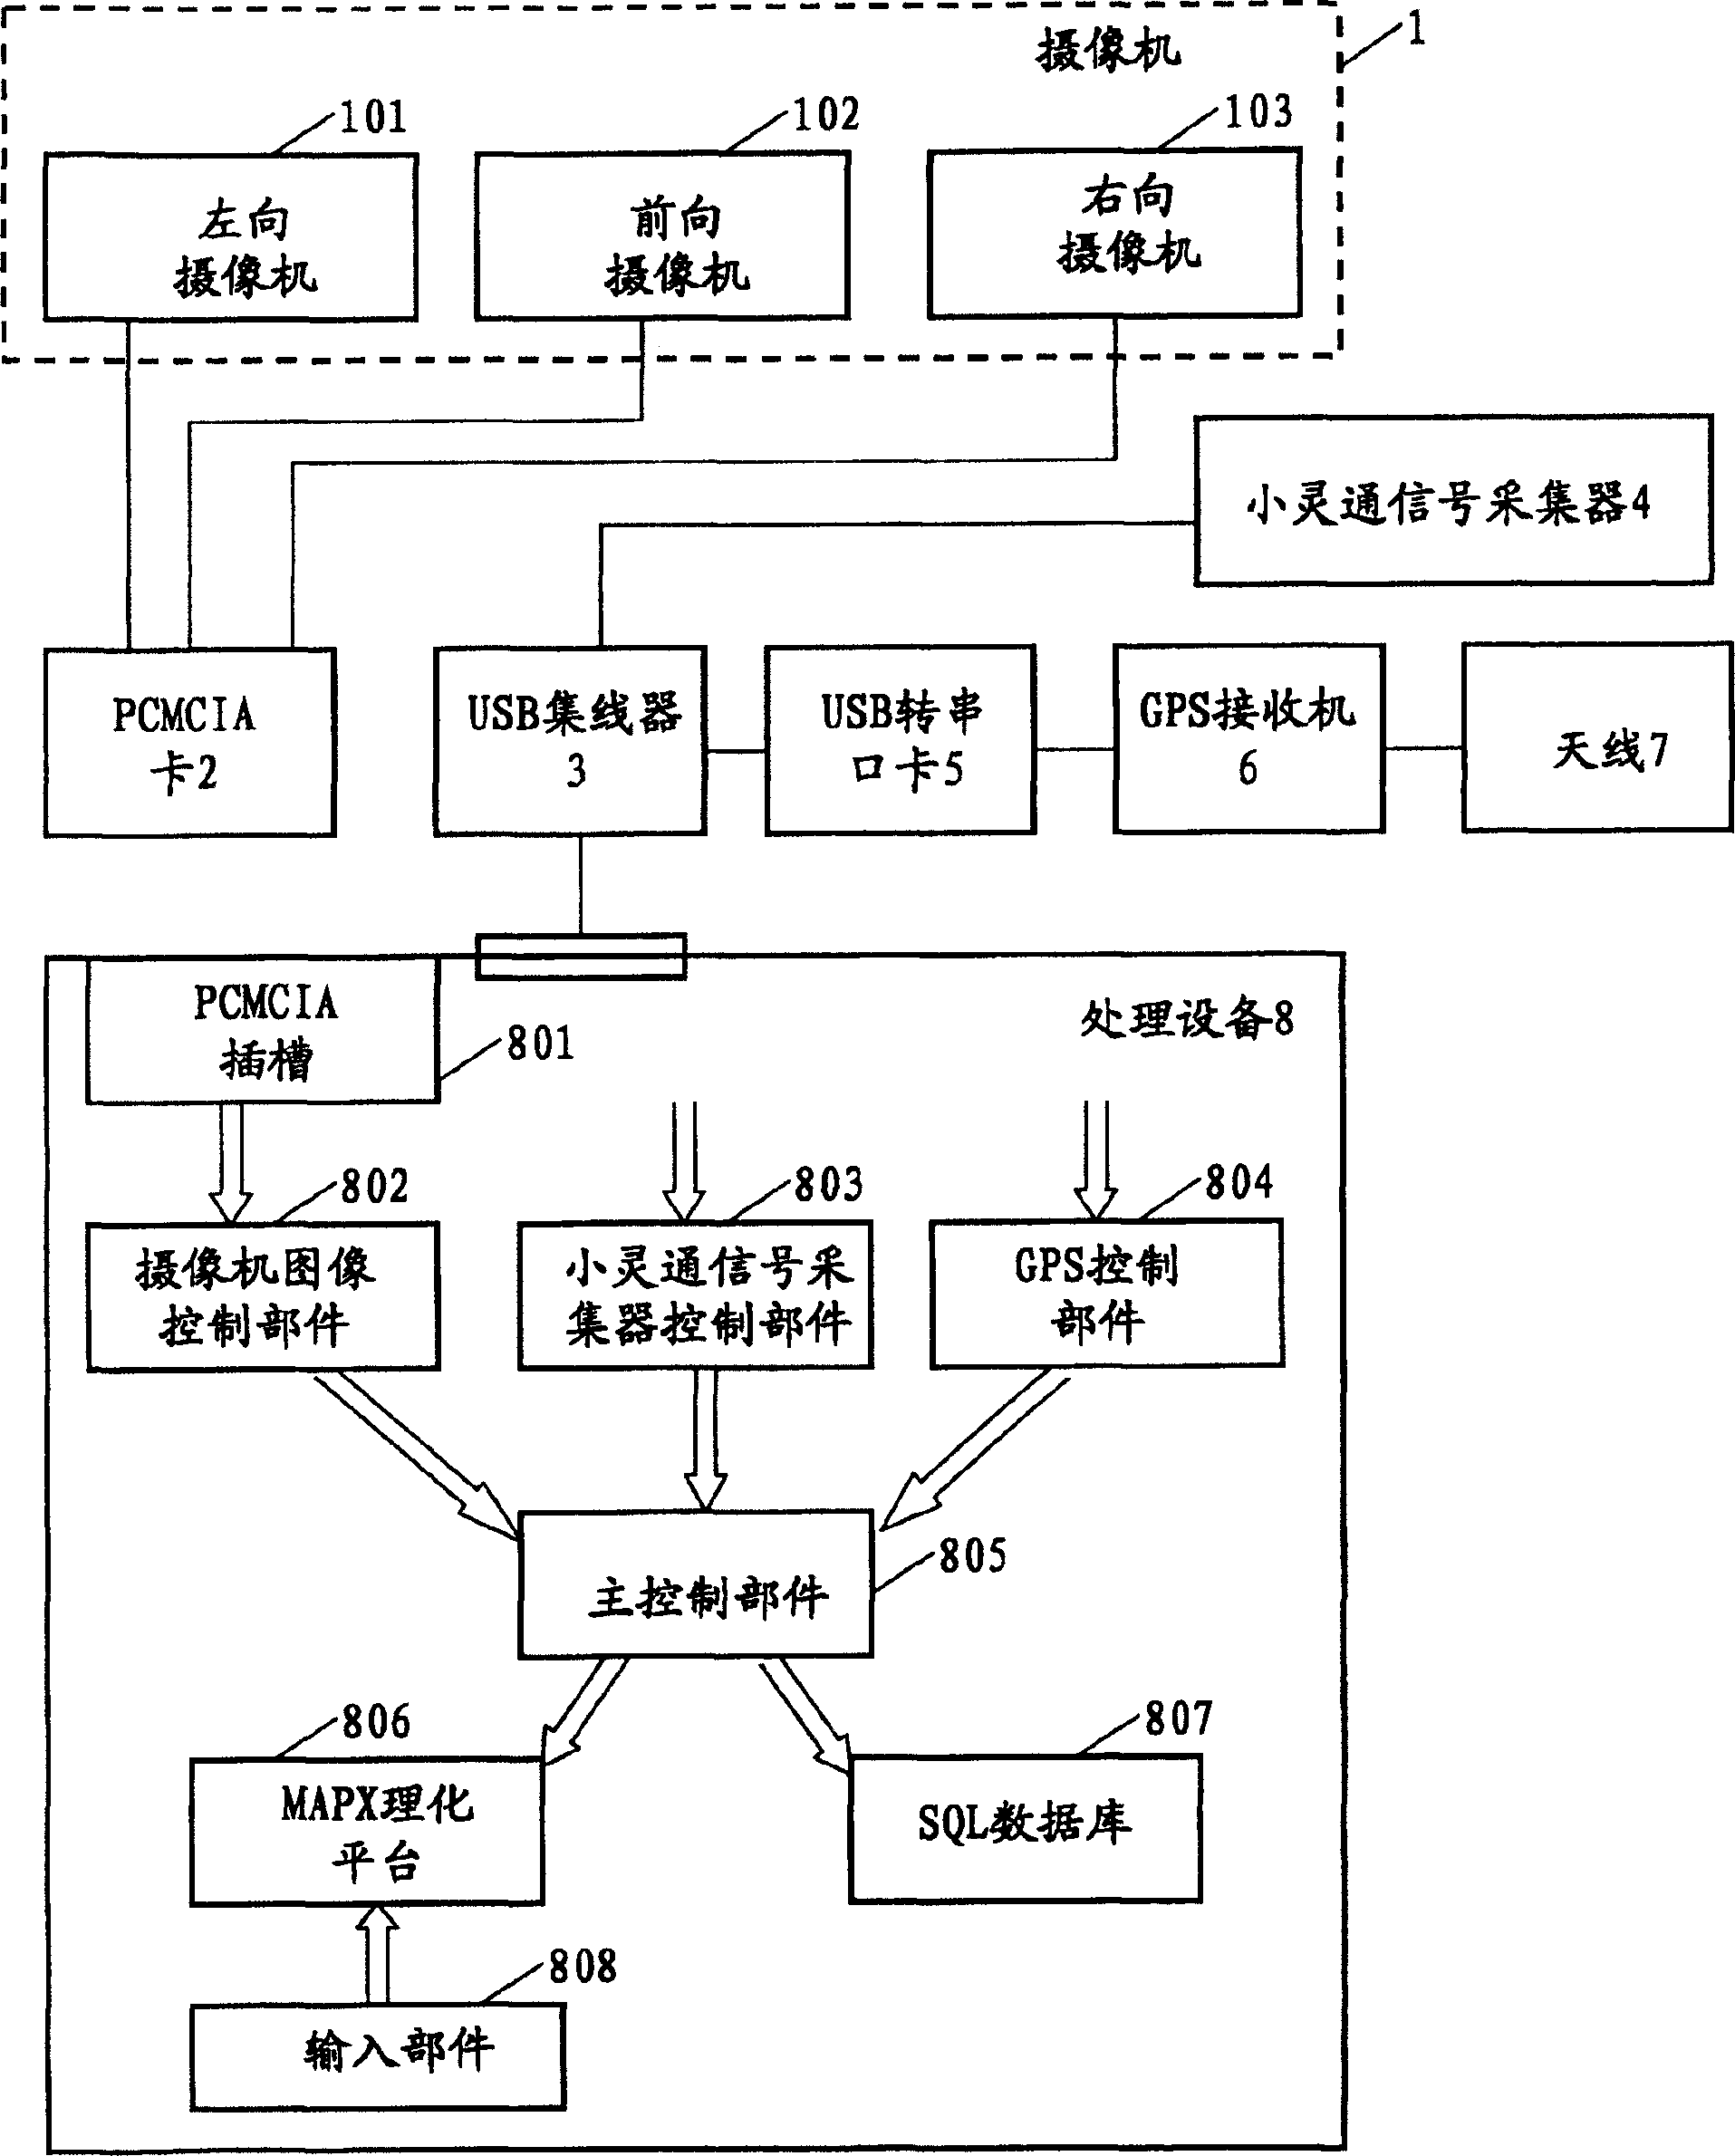
[0049] The invention provides a PHS network data collection and analysis system with real scene data collection function, such as figure 1 shown, including:
[0050] Video camera (1), is used for collecting the real scene data of location, because there is not this part in the network data acquisition and analysis system of prior art, so can not gather real scene data and analyze in prior art, and the present invention can pass camera ( 1) collect the real scene data of the location; be used to collect the PHS signal collector (4) of the PHS wireless signal on the location, this part can be a PH970 PHS signal collector, and the PH970 PHS signal collector is An existing device, it can collect the wireless signal of the location, thereby carry out coverage analysis, because this part also has adopted in the prior art, so do not go into details; GPS receiver (6), is used for tracking GPS satellite, calculates the location Positioning, GPS is the abbreviation of Global Positionin...
PUM
 Abstract
Description
Claims
Application Information