
Method for applying expert usage based data

Active Publication Date: 2019-07-09
LAKOWSKE STEPHEN D +2
View PDF22 Cites 0 Cited by
  • Summary
  • Abstract
  • Description
  • Claims
  • Application Information

AI Technical Summary

Problems solved by technology

The problem with using Equation 1 is that it treats all line segment lengths in the same way whereas that may not necessarily be the case.
Again this may not be valid for certain applications.
For example, in the insurance example an automobile that accelerates from 0 MPH to 65 MPH in 20 seconds might be perfectly safe in some cases yet risky in others.
Yet, if the same car were stopped on an expressway due to a traffic jam, the acceleration would be considered highly risky because it would suggest that the car is driving in a dangerous traffic condition which is more likely to result in an accident and an insurance claim.
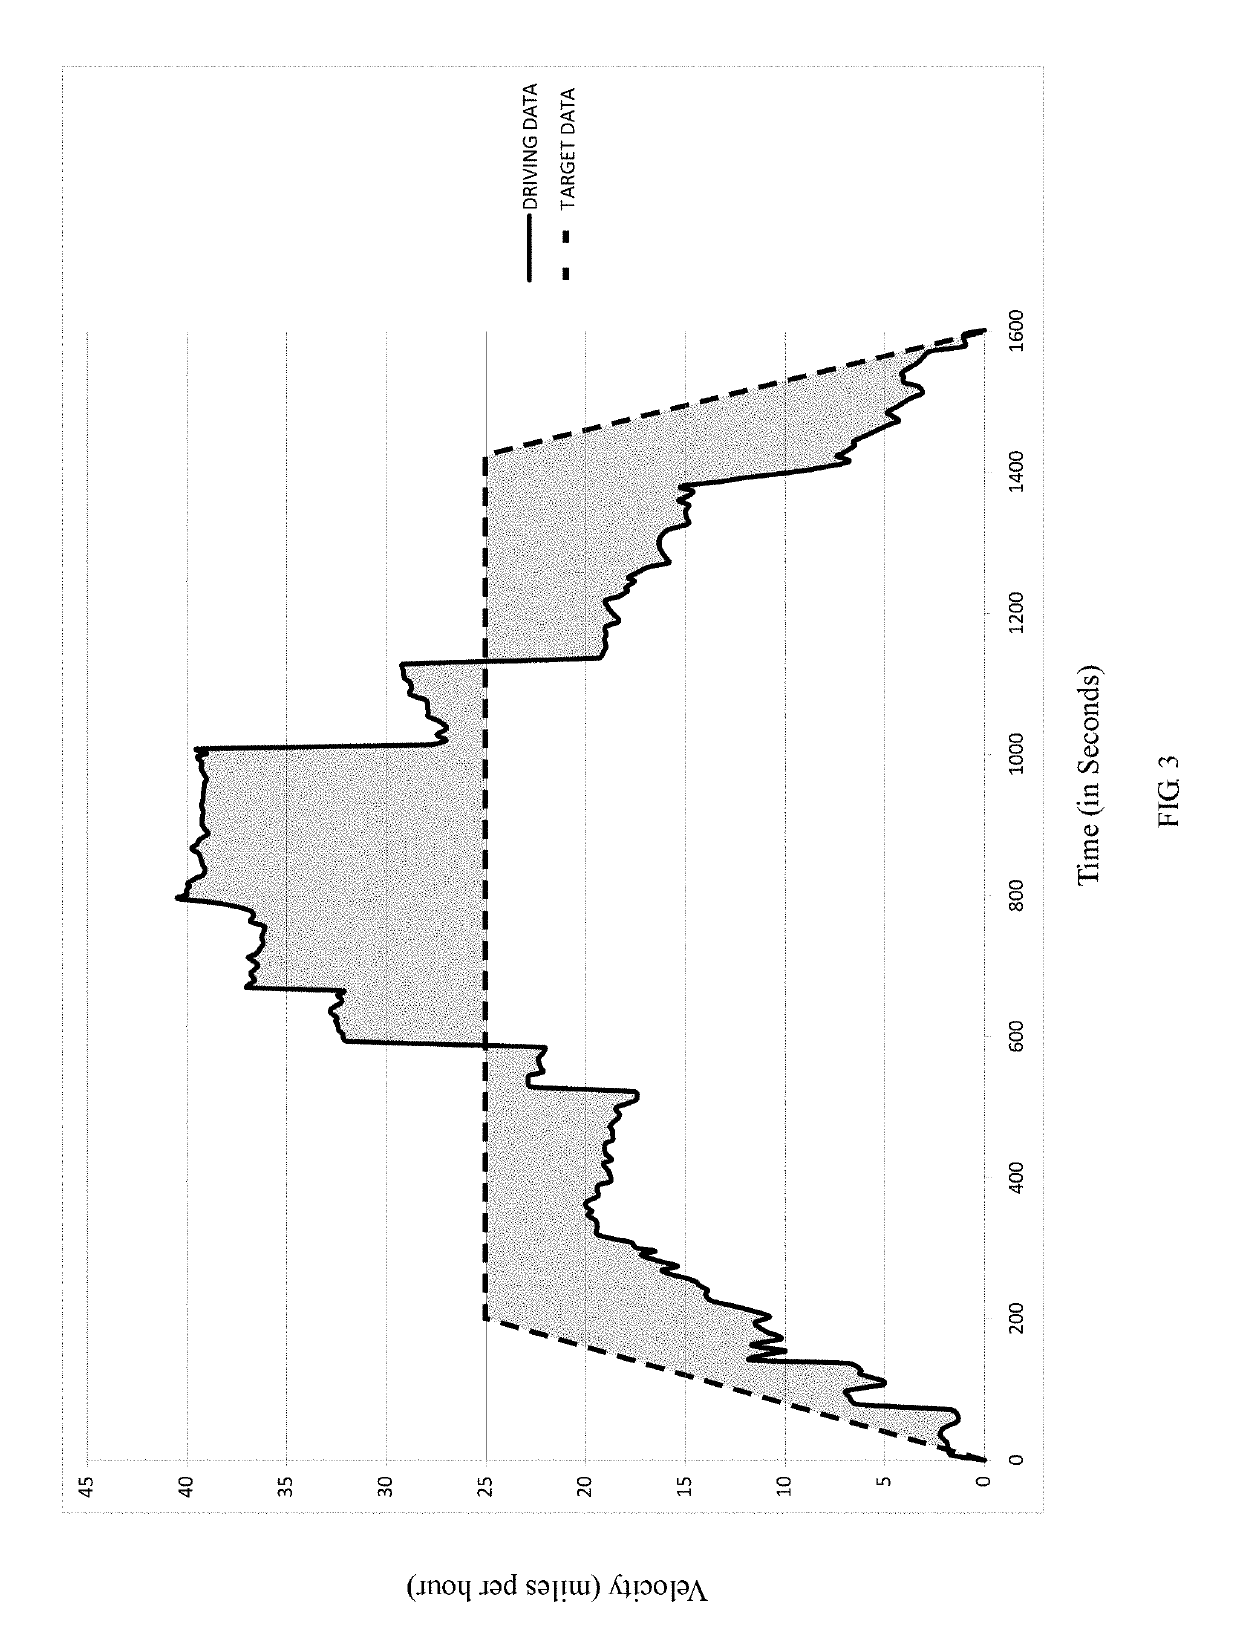
In this example, a small variation from the expert is desirable and a large variation is undesirable.
It is assumed that the greater the deviation from the expert data, the greater the risk.
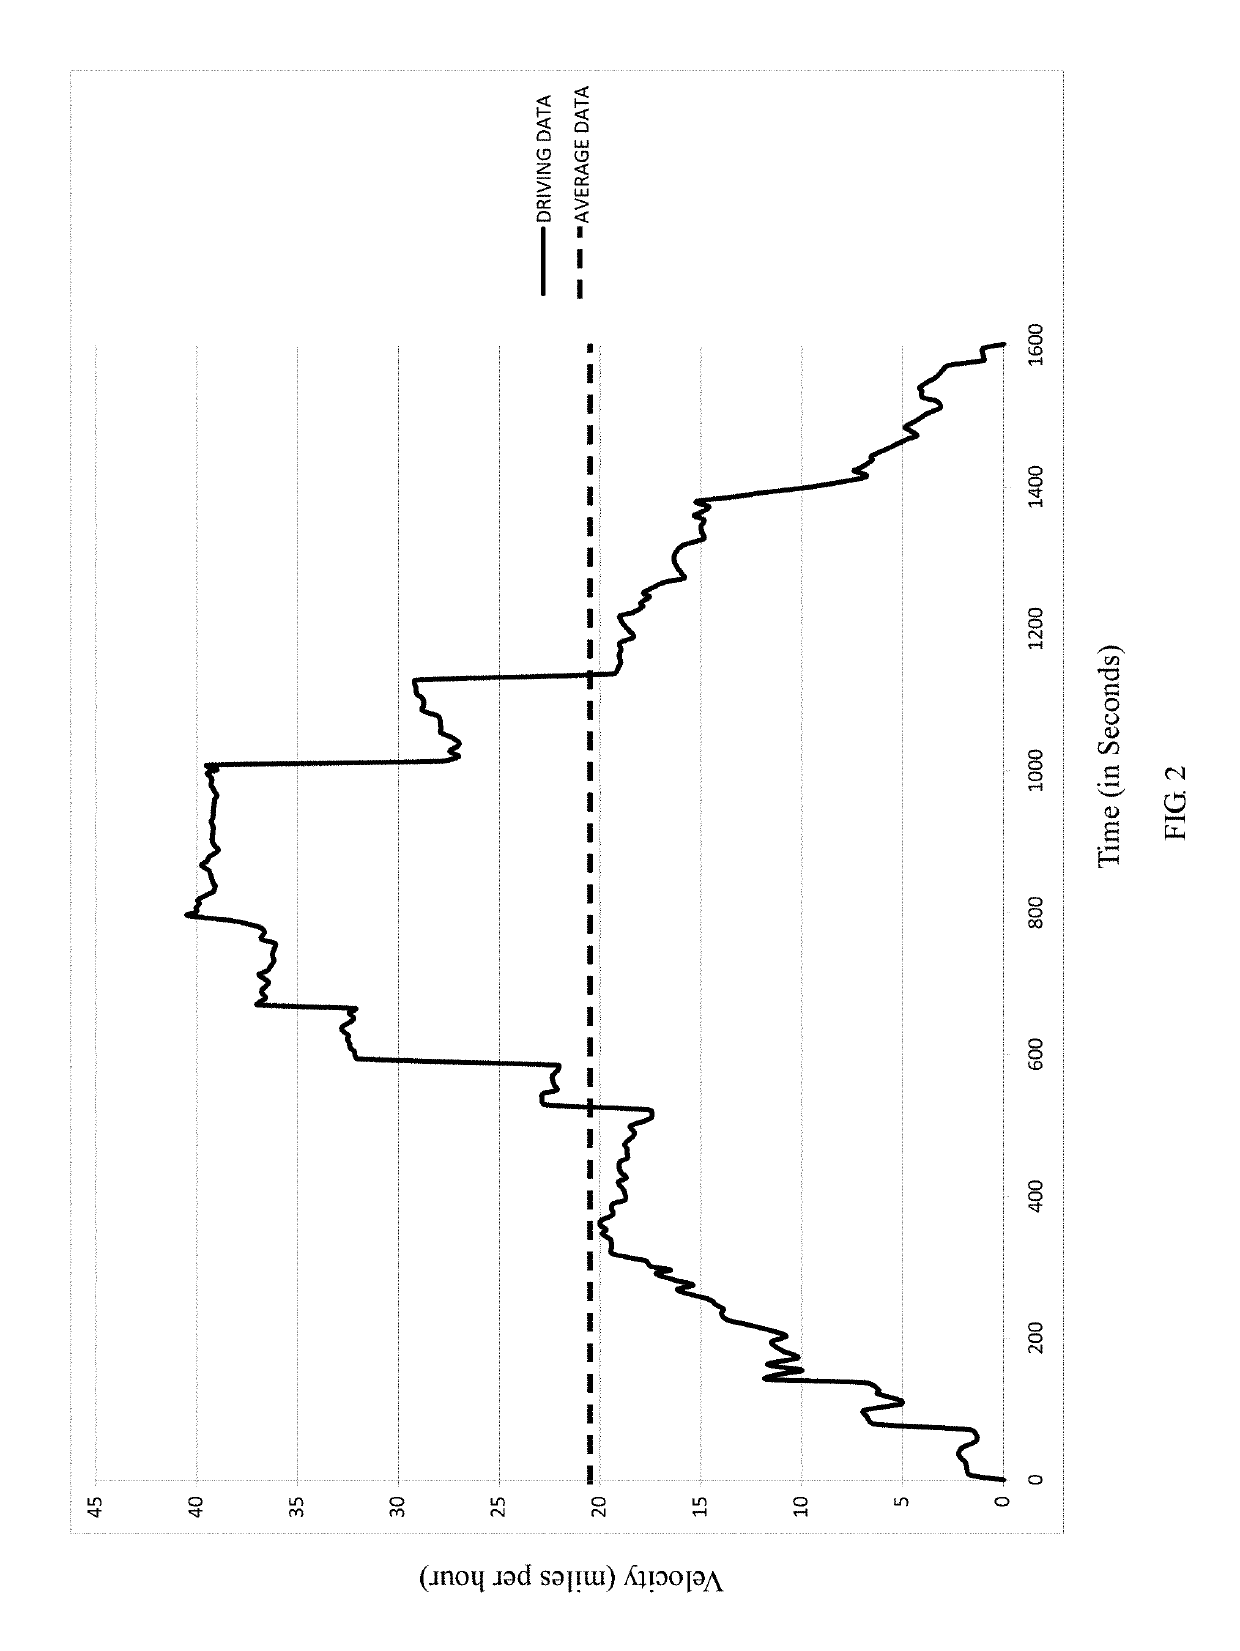
The problem with this technique is that it is comparing an operator's behavior to an artificial behavior (single average value) that can never occur.
Not only is the operator being measured against an impossible standard, but there is no evidence to suggest that this is actually safer than the operator's true behavior where the operator must obey speed limits and traffic signals.
Clearly crowded traffic and slippery roads would make the trip more risky to

Method used


Image

  • Method for applying expert usage based data
  • Method for applying expert usage based data
  • Method for applying expert usage based data

Examples


Example

DETAILED DESCRIPTION OF THE DRAWINGS

Prior Art Analysis of Analyzing Consumer Automobile Driving Data

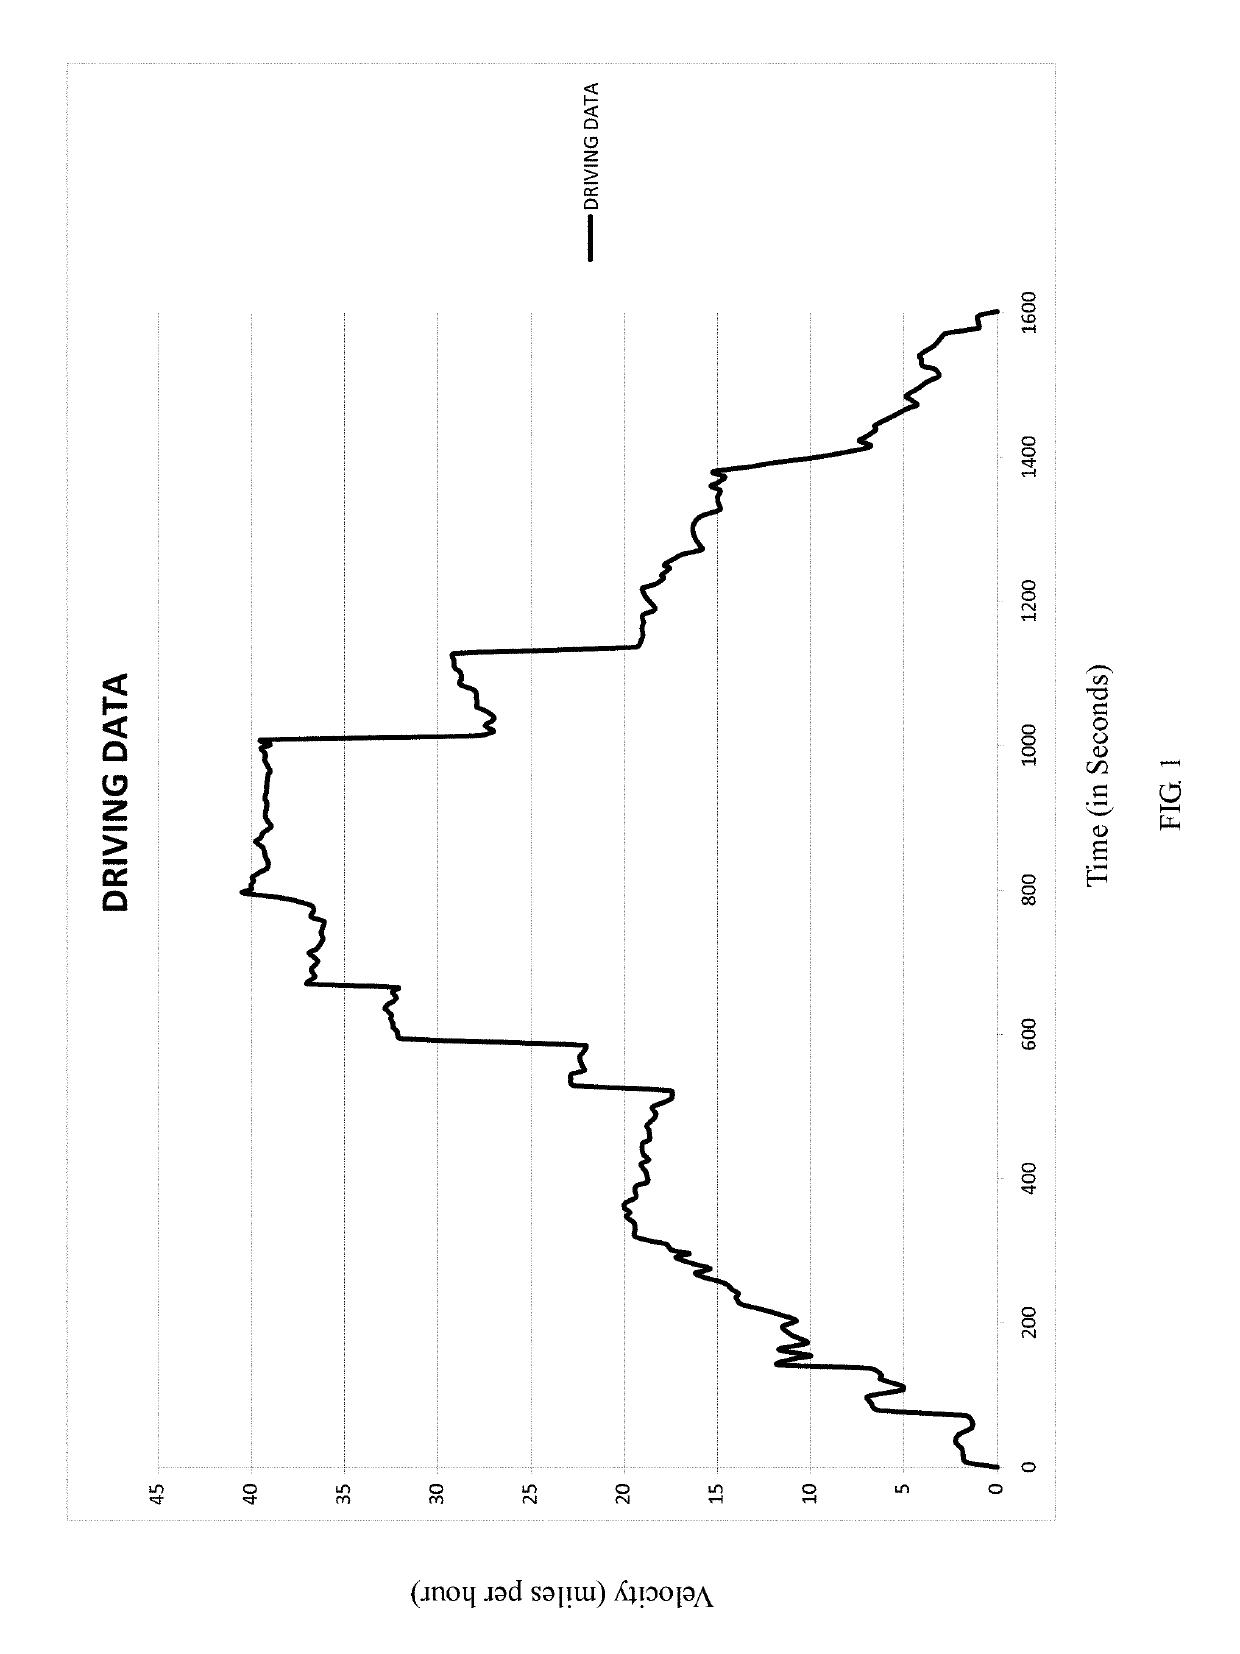
[0037]The chart in FIG. 1 depicts a hypothetical automobile trip where an automobile drives at different speeds (Y-AXIS=Miles per Hour) for 1600 seconds, approximately 27 minutes, (X-AXIS=elapsed Time in Seconds). From the figure, it is seen that the automobile travels at different speeds throughout the trip.

[0038]The data in FIG. 1 is analyzed by converting it into a continuous X-Y plot. The X-Y value can be any combination of variables collected. For example, the X coordinate might be the number of seconds that have elapsed since an automobile was started. The Y value may be the average speed of operation at the time the data is collected. As illustrated, X-Axis=Seconds, and Y-Axis=Miles Per Hour.

[0039]LineLength1,2=(x1-x2)2+(y1-y2)2(Equation⁢⁢1)

[0040]It is possible to measure the line length of a line segment by applying the Euclidean distance formula given in Equation 1. Prior to ...


PUM


Abstract

A method for creating a score or value based on the difference between non-expert and expert usage based data. The score or value may be used in variety of situations such as assessing risk, training, operator classification, and identifying expertise level of an operator.

Description

RELATED APPLICATIONS[0001]This application is a continuation-in-part of copending U.S. patent application Ser. No. 14 / 707,018 filed May 8, 2015 which is a division and continuation of U.S. patent application Ser. No. 13 / 549,498 filed Jul. 15, 2012, now U.S. Pat. No. 9,082,072, which claims priority under 35 U.S.C. 119(e) from U.S. Provisional Patent Application Ser. No. 61 / 508,024 filed Jul. 14, 2011, all incorporated herein by reference.BACKGROUND OF INVENTION[0002]Recent advances in electronics have made possible the sensing and collection of data from various physical systems which relates to both the operation of the physical system and the conditions under which the system is being operated. This data may include, but is not limited to, how, when, and where a system is being operated. This type of data is referred to herein as usage based data. Examples of physical systems where usage based data can be collected may include, but are not limited to, automobiles, airplanes, motor...

Claims


Application Information

Patent Timeline
IPC IPC(8): G06Q10/06G06Q40/08
CPCG06Q10/06398G06Q40/08
Inventor LAKOWSKE, STEPHEN D.WEDDING, JR., DONALD K.WEDDING, DANIEL K.
Owner LAKOWSKE STEPHEN D
Learn More